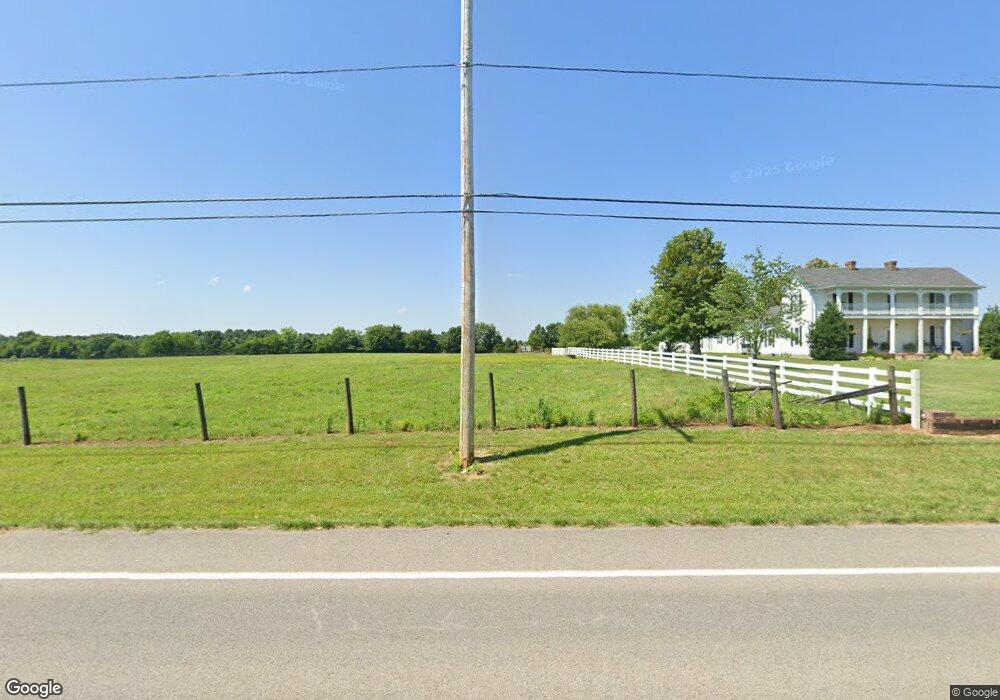
2850 Highway 64 W Lewisburg, TN 37091
Estimated Value: $972,000 - $1,390,000
9
Beds
6
Baths
8,146
Sq Ft
$137/Sq Ft
Est. Value
About This Home
This home is located at 2850 Highway 64 W, Lewisburg, TN 37091 and is currently estimated at $1,116,412, approximately $137 per square foot. 2850 Highway 64 W is a home located in Bedford County with nearby schools including Liberty Elementary School and Shelbyville Central High School.
Ownership History
Date
Name
Owned For
Owner Type
Purchase Details
Closed on
Feb 7, 2019
Sold by
Head Donna K
Bought by
Cozart Brooks Everett and Cozart Charles Matthew
Current Estimated Value
Purchase Details
Closed on
Aug 27, 2013
Sold by
Head Bert L
Bought by
Head Donna K
Purchase Details
Closed on
Feb 12, 2013
Sold by
Head Donna K Everett
Bought by
Head Bert L
Purchase Details
Closed on
Sep 26, 2011
Sold by
Beshears Daffney Suzanne
Bought by
Everett Donna K
Purchase Details
Closed on
Oct 13, 2003
Sold by
Six and Bobbye
Bought by
Gowan John and Gowan Donna
Home Financials for this Owner
Home Financials are based on the most recent Mortgage that was taken out on this home.
Original Mortgage
$150,000
Interest Rate
6.16%
Purchase Details
Closed on
Dec 8, 1995
Bought by
Six Bobbye J
Purchase Details
Closed on
Feb 28, 1992
Bought by
Priamos Judy G
Purchase Details
Closed on
Aug 22, 1985
Bought by
Priamos Paul D and Priamos Judy G
Create a Home Valuation Report for This Property
The Home Valuation Report is an in-depth analysis detailing your home's value as well as a comparison with similar homes in the area
Home Values in the Area
Average Home Value in this Area
Purchase History
| Date | Buyer | Sale Price | Title Company |
|---|---|---|---|
| Cozart Brooks Everett | -- | None Available | |
| Head Donna K | -- | -- | |
| Head Bert L | -- | -- | |
| Everett Donna K | -- | -- | |
| Gowan John | $350,000 | -- | |
| Six Bobbye J | $215,000 | -- | |
| Priamos Judy G | -- | -- | |
| Priamos Paul D | $195,000 | -- |
Source: Public Records
Mortgage History
| Date | Status | Borrower | Loan Amount |
|---|---|---|---|
| Previous Owner | Priamos Paul D | $150,000 |
Source: Public Records
Tax History Compared to Growth
Tax History
| Year | Tax Paid | Tax Assessment Tax Assessment Total Assessment is a certain percentage of the fair market value that is determined by local assessors to be the total taxable value of land and additions on the property. | Land | Improvement |
|---|---|---|---|---|
| 2025 | $3,197 | $137,475 | $0 | $0 |
| 2024 | $3,197 | $137,475 | $16,875 | $120,600 |
| 2023 | $2,683 | $115,400 | $16,875 | $98,525 |
| 2022 | $2,683 | $115,400 | $16,875 | $98,525 |
| 2021 | $2,268 | $115,400 | $16,875 | $98,525 |
| 2020 | $2,470 | $115,400 | $16,875 | $98,525 |
| 2019 | $2,500 | $92,875 | $15,125 | $77,750 |
| 2018 | $2,406 | $93,975 | $16,225 | $77,750 |
| 2017 | $2,406 | $93,975 | $16,225 | $77,750 |
| 2016 | $2,368 | $93,975 | $0 | $0 |
| 2015 | $2,368 | $93,975 | $0 | $0 |
| 2014 | $2,094 | $92,268 | $0 | $0 |
Source: Public Records
Map
Nearby Homes
- 350 Helton Rd
- 339 Jack Pickle Rd
- 358 Jack Pickle Rd
- 417 Haskins Chapel Rd
- 385 Palmetto Rd
- 344 Whitaker Rd
- 330 John Shaw Rd
- 2882 Gold Rd
- 2624 Highway 64
- 329 Palmetto Rd
- 201 John Shaw Rd
- 129 John Shaw Rd
- 8 Mount Lebanon Church Rd
- 5 Mount Lebanon Church Rd
- 6 Mount Lebanon Church Rd
- 2105 Laws Hill Rd
- 2101 Laws Hill Rd
- 2108 Laws Hill Rd
- 0 Laws Hill Rd
- 2309 Hunter Rd
- 2839 Highway 64 W
- 2839 Highway 64 W
- 2847 Tennessee 64
- 2855 Highway 64 W
- 2858 Highway 64 W
- 2829 Highway 64 W
- 2835 Highway 64 W
- 2870 Highway 64 W
- 2870 Highway 64 W
- 2870 Hwy 64 W
- 2835 Tennessee 64
- 2904 Tennessee 64
- 2906 Tennessee 64
- 2857 2857
- 0 Hwy 64 W Unit 1592042
- 0 Hwy 64 W Unit 1748825
- 0 Hwy 64 W Unit 23257228
- 0 Hwy 64 W Unit 2240479
- 0 Hwy 64 W Unit 2110263
- 0 Hwy 64 W Unit 2093556