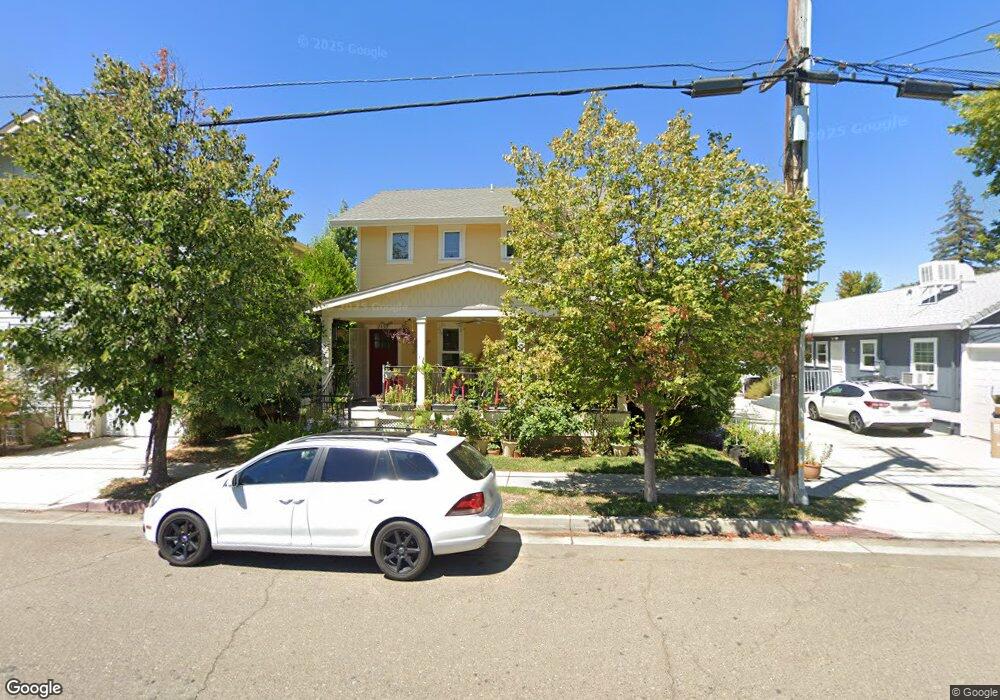
2850 Leland Ave Redding, CA 96001
Parkview NeighborhoodEstimated Value: $231,000 - $301,000
2
Beds
2
Baths
1,000
Sq Ft
$262/Sq Ft
Est. Value
About This Home
This home is located at 2850 Leland Ave, Redding, CA 96001 and is currently estimated at $261,794, approximately $261 per square foot. 2850 Leland Ave is a home located in Shasta County with nearby schools including Juniper, Sequoia Middle School, and Shasta High School.
Ownership History
Date
Name
Owned For
Owner Type
Purchase Details
Closed on
May 11, 2022
Sold by
Morris and Mark
Bought by
Cato Mark and Morris Michelle
Current Estimated Value
Purchase Details
Closed on
May 11, 2017
Sold by
Martin Nina A and Herrera Nina
Bought by
Morris Michelle and Cato Mark
Home Financials for this Owner
Home Financials are based on the most recent Mortgage that was taken out on this home.
Original Mortgage
$116,250
Interest Rate
3.39%
Mortgage Type
New Conventional
Purchase Details
Closed on
Jan 21, 2013
Sold by
Mills Garrett D
Bought by
Herrera Nina A
Purchase Details
Closed on
Feb 18, 2010
Sold by
Dinning John W
Bought by
Dinning John W and Dinning Hilary
Purchase Details
Closed on
Oct 15, 2009
Sold by
Dinning Hilary N
Bought by
Dinning John W
Purchase Details
Closed on
Sep 20, 2005
Sold by
Parkview Neighborhood Llc
Bought by
Dinning John W and Dinning Hilary N
Home Financials for this Owner
Home Financials are based on the most recent Mortgage that was taken out on this home.
Original Mortgage
$210,000
Interest Rate
6.21%
Mortgage Type
Purchase Money Mortgage
Purchase Details
Closed on
Feb 18, 2001
Sold by
Dinning John W and Dinning Hilary N
Bought by
Herrera Nina A and Mills Garrett D
Home Financials for this Owner
Home Financials are based on the most recent Mortgage that was taken out on this home.
Original Mortgage
$132,554
Interest Rate
5.25%
Mortgage Type
FHA
Create a Home Valuation Report for This Property
The Home Valuation Report is an in-depth analysis detailing your home's value as well as a comparison with similar homes in the area
Home Values in the Area
Average Home Value in this Area
Purchase History
| Date | Buyer | Sale Price | Title Company |
|---|---|---|---|
| Cato Mark | -- | None Listed On Document | |
| Morris Michelle | $155,000 | First American Title Company | |
| Martin Nina A | -- | First American Title Company | |
| Herrera Nina A | -- | None Available | |
| Dinning John W | -- | Placer Title Company | |
| Dinning John W | -- | Fidelity Natl Title Co Of Ca | |
| Dinning John W | $210,000 | Alliance Title Company | |
| Herrera Nina A | $135,000 | Placer Title Company |
Source: Public Records
Mortgage History
| Date | Status | Borrower | Loan Amount |
|---|---|---|---|
| Previous Owner | Morris Michelle | $116,250 | |
| Previous Owner | Dinning John W | $210,000 | |
| Previous Owner | Herrera Nina A | $132,554 |
Source: Public Records
Tax History
| Year | Tax Paid | Tax Assessment Tax Assessment Total Assessment is a certain percentage of the fair market value that is determined by local assessors to be the total taxable value of land and additions on the property. | Land | Improvement |
|---|---|---|---|---|
| 2025 | $2,238 | $179,886 | $34,815 | $145,071 |
| 2024 | $2,199 | $176,360 | $34,133 | $142,227 |
| 2023 | $2,199 | $172,903 | $33,464 | $139,439 |
| 2022 | $2,173 | $169,513 | $32,808 | $136,705 |
| 2021 | $2,164 | $166,190 | $32,165 | $134,025 |
| 2020 | $2,181 | $164,487 | $31,836 | $132,651 |
| 2019 | $2,061 | $161,262 | $31,212 | $130,050 |
| 2018 | $2,090 | $158,100 | $30,600 | $127,500 |
| 2017 | $1,981 | $150,142 | $33,363 | $116,779 |
| 2016 | $1,973 | $147,199 | $32,709 | $114,490 |
| 2015 | $1,387 | $115,000 | $30,000 | $85,000 |
| 2014 | $1,458 | $105,000 | $30,000 | $75,000 |
Source: Public Records
Map
Nearby Homes
- 864 Kite Ln
- 745 Parkview Ave
- 1012 State St
- 351 Weldon St
- 2514 California St
- 3244 Veda St
- 2405 Cliff Dr
- 3443 West St
- 815 Locust St
- 2590 Henderson Rd
- 2123 Waldon St
- 2239 Garden Ave
- 2630 Wyndham Ln
- 1005 Gold St
- 2845 River Mist Walk
- 2857 River Mist Walk
- 2865 River Mist Walk
- 350 Park Marina Cir
- 2056 Canal Dr
- 3496 Summit Dr
Your Personal Tour Guide
Ask me questions while you tour the home.