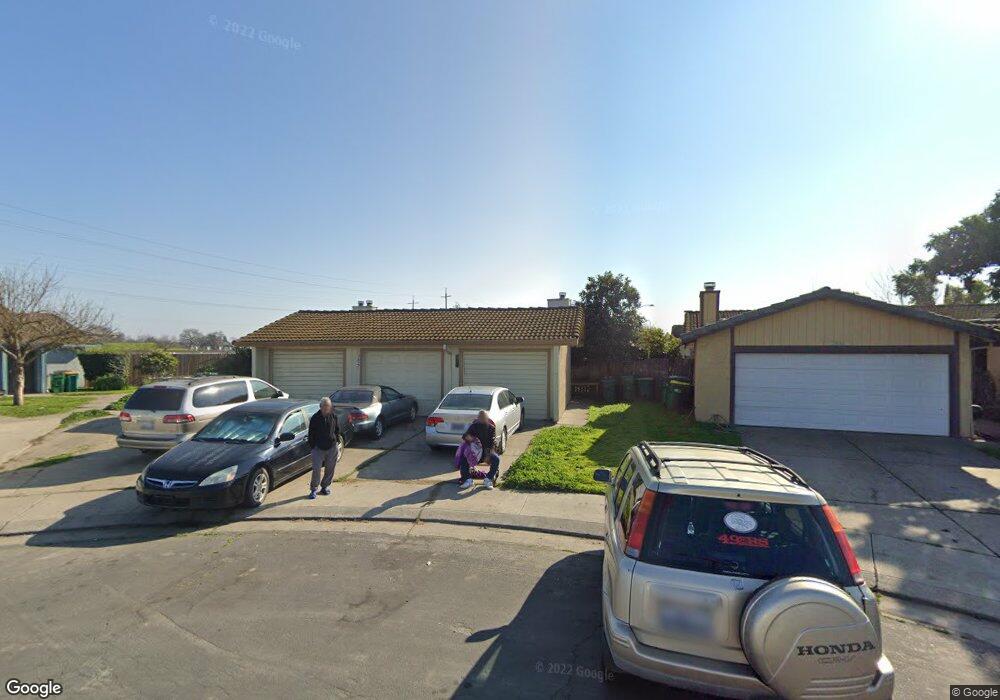
2850 Saffron Way Stockton, CA 95210
Valley Oak NeighborhoodEstimated Value: $500,000 - $562,000
18
Beds
9
Baths
2,774
Sq Ft
$187/Sq Ft
Est. Value
About This Home
This home is located at 2850 Saffron Way, Stockton, CA 95210 and is currently estimated at $517,877, approximately $186 per square foot. 2850 Saffron Way is a home located in San Joaquin County with nearby schools including Davis Elementary School, Morada Middle School, and Ronald E. McNair High School.
Ownership History
Date
Name
Owned For
Owner Type
Purchase Details
Closed on
Jun 9, 2023
Sold by
Nguyen Phuc Thi Minh
Bought by
Zhang Zhen Rui
Current Estimated Value
Home Financials for this Owner
Home Financials are based on the most recent Mortgage that was taken out on this home.
Original Mortgage
$350,000
Outstanding Balance
$340,709
Interest Rate
6.43%
Mortgage Type
New Conventional
Estimated Equity
$177,168
Purchase Details
Closed on
Jun 8, 2023
Sold by
Steve Chi Kin Man and Steve Pauline Cook-Naw
Bought by
Zhang Zhen Rui
Home Financials for this Owner
Home Financials are based on the most recent Mortgage that was taken out on this home.
Original Mortgage
$350,000
Outstanding Balance
$340,709
Interest Rate
6.43%
Mortgage Type
New Conventional
Estimated Equity
$177,168
Purchase Details
Closed on
Jan 6, 1996
Sold by
Man Steve Chi Kin and Man Pauline Cook Naw
Bought by
Man Steve Chi Kin and Man Pauline Cook Naw
Create a Home Valuation Report for This Property
The Home Valuation Report is an in-depth analysis detailing your home's value as well as a comparison with similar homes in the area
Home Values in the Area
Average Home Value in this Area
Purchase History
| Date | Buyer | Sale Price | Title Company |
|---|---|---|---|
| Zhang Zhen Rui | -- | Old Republic Title | |
| Zhang Zhen Rui | $500,000 | Old Republic Title | |
| Man Steve Chi Kin | -- | -- |
Source: Public Records
Mortgage History
| Date | Status | Borrower | Loan Amount |
|---|---|---|---|
| Open | Zhang Zhen Rui | $350,000 |
Source: Public Records
Tax History Compared to Growth
Tax History
| Year | Tax Paid | Tax Assessment Tax Assessment Total Assessment is a certain percentage of the fair market value that is determined by local assessors to be the total taxable value of land and additions on the property. | Land | Improvement |
|---|---|---|---|---|
| 2025 | $5,854 | $520,200 | $130,050 | $390,150 |
| 2024 | $5,746 | $510,000 | $127,500 | $382,500 |
| 2023 | $2,876 | $249,997 | $52,299 | $197,698 |
| 2022 | $2,812 | $245,096 | $51,274 | $193,822 |
| 2021 | $2,876 | $240,291 | $50,269 | $190,022 |
| 2020 | $2,808 | $237,828 | $49,754 | $188,074 |
| 2019 | $2,743 | $233,166 | $48,779 | $184,387 |
| 2018 | $2,695 | $228,595 | $47,823 | $180,772 |
| 2017 | $2,632 | $224,114 | $46,886 | $177,228 |
| 2016 | $2,480 | $219,720 | $45,967 | $173,753 |
| 2014 | $2,082 | $180,000 | $37,000 | $143,000 |
Source: Public Records
Map
Nearby Homes
- 9332 Kirkby Ln
- 9321 Kirkby Ln
- 2619 Claridge Ln
- 8916 Fox Creek Dr
- 8904 Fox Creek Dr Unit 84
- 9314 Cherbourg Way
- 3069 Nicoletta Ln
- 9253 Bridalveil Cir
- 9308 Pioneer Cir
- 8837 Fox Creek Dr Unit 1
- 9829 Priscilla Ln
- 2270 Ringwood Ave
- 3484 Cathedral Cir
- 9355 Snow Creek Cir
- 8600 West Ln Unit 154
- 8600 West Ln Unit 116
- 8600 West Ln Unit 68
- 8600 West Ln Unit 92
- 8600 West Ln Unit 172
- 8600 West Ln Unit 76
- 2854 Saffron Way
- 2858 Saffron Way
- 2842 Saffron Way
- 9356 Kirkby Ln
- 9364 Kirkby Ln
- 2836 Saffron Way
- 9374 Kirkby Ln
- 9348 Kirkby Ln
- 2847 Saffron Way
- 2839 Saffron Way
- 2831 Saffron Way
- 9340 Kirkby Ln
- 2825 Saffron Way
- 9409 Kirkby Ln
- 2823 Saffron Way
- 9417 Kirkby Ln
- 9326 Kirkby Ln
- 9401 Kirkby Ln
- 9355 Kirkby Ln
- 2815 Saffron Way