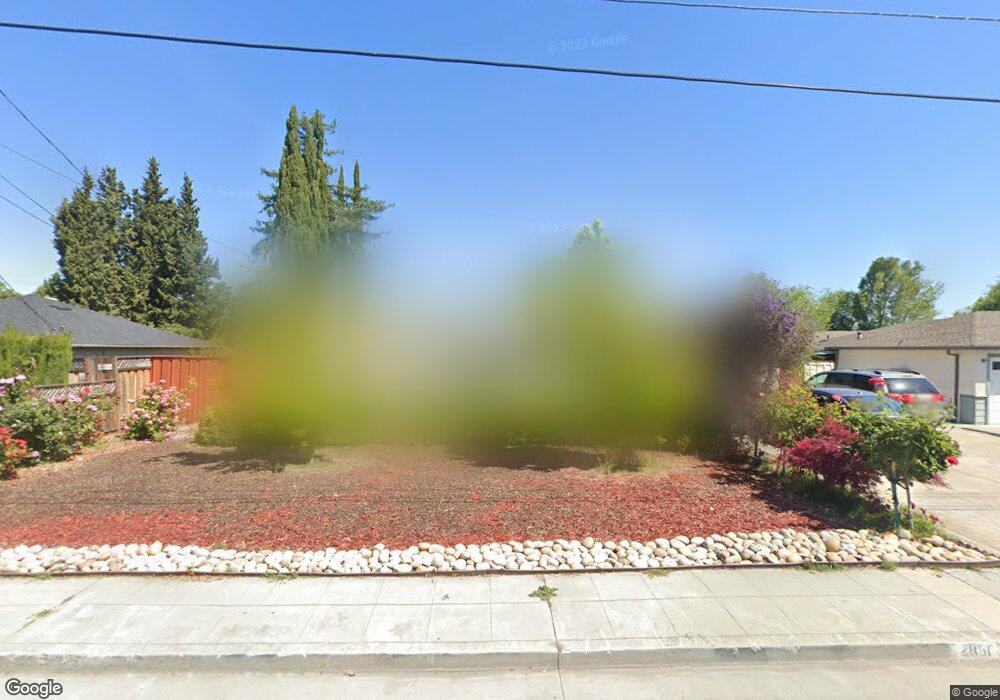
2851 Orthello Way Santa Clara, CA 95051
Estimated Value: $1,708,000 - $1,908,000
3
Beds
1
Bath
1,024
Sq Ft
$1,742/Sq Ft
Est. Value
About This Home
This home is located at 2851 Orthello Way, Santa Clara, CA 95051 and is currently estimated at $1,783,955, approximately $1,742 per square foot. 2851 Orthello Way is a home located in Santa Clara County with nearby schools including Pomeroy Elementary School, Juan Cabrillo Middle School, and Santa Clara High School.
Ownership History
Date
Name
Owned For
Owner Type
Purchase Details
Closed on
Aug 25, 2004
Sold by
Pararajasingham Kulasingham and Kulasingham Vasanthini
Bought by
Pararajasingham Kulasingham and Kulasingham Vasanthini
Current Estimated Value
Home Financials for this Owner
Home Financials are based on the most recent Mortgage that was taken out on this home.
Original Mortgage
$508,000
Outstanding Balance
$234,563
Interest Rate
4.87%
Mortgage Type
Purchase Money Mortgage
Estimated Equity
$1,549,392
Purchase Details
Closed on
May 20, 2004
Sold by
Guerra Albino and Guerra Lynne M
Bought by
Pararajasingham Kula and Kulasingham Vasanthini
Home Financials for this Owner
Home Financials are based on the most recent Mortgage that was taken out on this home.
Original Mortgage
$508,000
Interest Rate
6%
Mortgage Type
Purchase Money Mortgage
Create a Home Valuation Report for This Property
The Home Valuation Report is an in-depth analysis detailing your home's value as well as a comparison with similar homes in the area
Home Values in the Area
Average Home Value in this Area
Purchase History
| Date | Buyer | Sale Price | Title Company |
|---|---|---|---|
| Pararajasingham Kulasingham | -- | Chicago Title | |
| Pararajasingham Kula | $635,000 | First American Title Company |
Source: Public Records
Mortgage History
| Date | Status | Borrower | Loan Amount |
|---|---|---|---|
| Open | Pararajasingham Kulasingham | $508,000 | |
| Closed | Pararajasingham Kula | $508,000 | |
| Closed | Pararajasingham Kula | $95,250 |
Source: Public Records
Tax History Compared to Growth
Tax History
| Year | Tax Paid | Tax Assessment Tax Assessment Total Assessment is a certain percentage of the fair market value that is determined by local assessors to be the total taxable value of land and additions on the property. | Land | Improvement |
|---|---|---|---|---|
| 2025 | $10,343 | $902,823 | $710,890 | $191,933 |
| 2024 | $10,343 | $885,121 | $696,951 | $188,170 |
| 2023 | $10,237 | $867,767 | $683,286 | $184,481 |
| 2022 | $10,064 | $850,753 | $669,889 | $180,864 |
| 2021 | $10,023 | $834,072 | $656,754 | $177,318 |
| 2020 | $9,841 | $825,520 | $650,020 | $175,500 |
| 2019 | $9,827 | $809,334 | $637,275 | $172,059 |
| 2018 | $9,194 | $793,466 | $624,780 | $168,686 |
| 2017 | $9,148 | $777,909 | $612,530 | $165,379 |
| 2016 | $8,954 | $762,657 | $600,520 | $162,137 |
| 2015 | $8,919 | $751,202 | $591,500 | $159,702 |
| 2014 | $7,412 | $643,000 | $506,300 | $136,700 |
Source: Public Records
Map
Nearby Homes
- 2785 Ball Place Unit 4
- 2782 Sonoma Place
- 986 Kiely Blvd Unit D
- 3079 El Camino Real Unit 101
- 3079 El Camino Real Unit 205
- 3079 El Camino Real Unit 202
- 3089 El Camino Real Unit 9
- 3089 El Camino Real Unit 7
- 3089 El Camino Real Unit 5
- 3089 El Camino Real Unit 11
- 940 Kiely Blvd Unit H
- 3033 Kaiser Dr Unit H
- 960 Kiely Blvd Unit F
- 1545 Pomeroy Ave
- 2475 Karen Dr
- 1496 Mcpherson St
- 1661 Nobili Ave
- 840 Quince Ave Unit 27
- 821 Kolb Place
- 834 Quince Ave Unit 37
- 2831 Orthello Way
- 2871 Orthello Way
- 2852 El Sobrante St
- 2836 El Sobrante St
- 2891 Orthello Way
- 2811 Orthello Way
- 2866 El Sobrante St
- 2820 El Sobrante St
- 2852 Orthello Way
- 2888 El Sobrante St
- 2832 Orthello Way
- 2872 Orthello Way
- 1270 Kiely Blvd
- 2911 Orthello Way
- 2812 Orthello Way
- 2892 Orthello Way
- 2904 El Sobrante St
- 2912 Orthello Way
- 2920 El Sobrante St
- 2931 Orthello Way