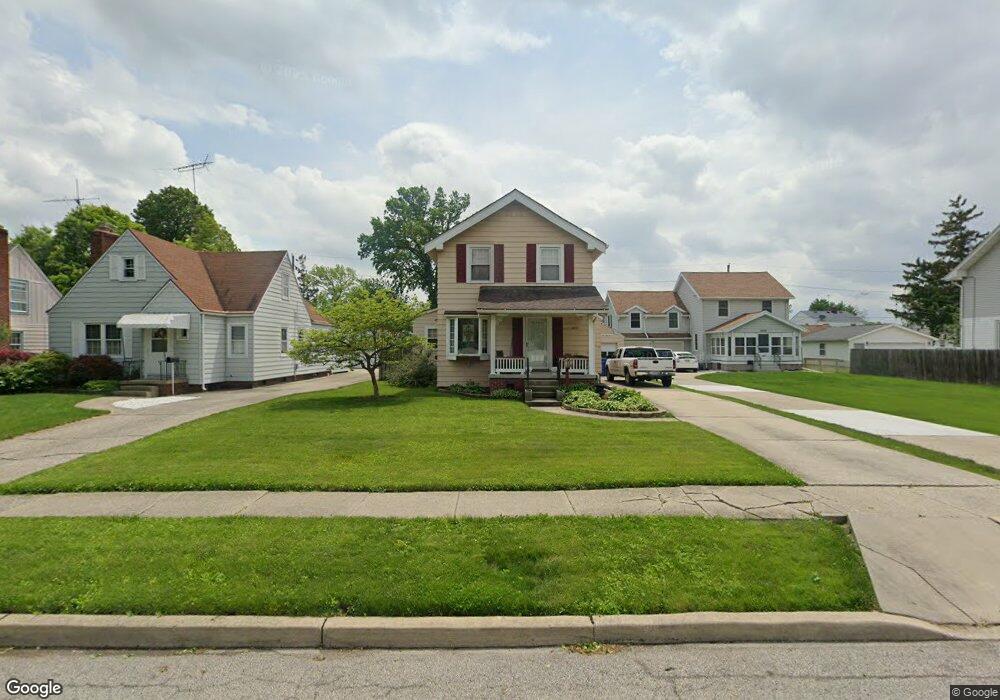
2852 116th St Toledo, OH 43611
Point Place NeighborhoodEstimated Value: $161,286 - $174,000
3
Beds
1
Bath
1,342
Sq Ft
$125/Sq Ft
Est. Value
About This Home
This home is located at 2852 116th St, Toledo, OH 43611 and is currently estimated at $168,072, approximately $125 per square foot. 2852 116th St is a home located in Lucas County with nearby schools including Ottawa River Elementary School, Woodward High School, and Imagine Environmental Science Academy.
Ownership History
Date
Name
Owned For
Owner Type
Purchase Details
Closed on
Jan 18, 2002
Sold by
Cooley William J and Cooley Tamara A
Bought by
Finfrock Heather E and Finfrock Heather
Current Estimated Value
Home Financials for this Owner
Home Financials are based on the most recent Mortgage that was taken out on this home.
Original Mortgage
$108,741
Outstanding Balance
$44,816
Interest Rate
7.16%
Mortgage Type
FHA
Estimated Equity
$123,256
Purchase Details
Closed on
Apr 19, 1999
Sold by
Bogielczyk Dawn M
Bought by
Cooley William J and Cooley Tamara A
Home Financials for this Owner
Home Financials are based on the most recent Mortgage that was taken out on this home.
Original Mortgage
$82,650
Interest Rate
7.17%
Purchase Details
Closed on
Jul 7, 1993
Sold by
Coffield Gloria J #
Purchase Details
Closed on
Jul 31, 1992
Sold by
Coffield R J and G J
Create a Home Valuation Report for This Property
The Home Valuation Report is an in-depth analysis detailing your home's value as well as a comparison with similar homes in the area
Home Values in the Area
Average Home Value in this Area
Purchase History
| Date | Buyer | Sale Price | Title Company |
|---|---|---|---|
| Finfrock Heather E | $109,900 | Perrysburg Title Agency Inc | |
| Cooley William J | $87,000 | Perrysburg Title Agency Inc | |
| -- | $66,000 | -- | |
| -- | -- | -- |
Source: Public Records
Mortgage History
| Date | Status | Borrower | Loan Amount |
|---|---|---|---|
| Open | Finfrock Heather E | $108,741 | |
| Previous Owner | Cooley William J | $82,650 |
Source: Public Records
Tax History Compared to Growth
Tax History
| Year | Tax Paid | Tax Assessment Tax Assessment Total Assessment is a certain percentage of the fair market value that is determined by local assessors to be the total taxable value of land and additions on the property. | Land | Improvement |
|---|---|---|---|---|
| 2024 | $1,364 | $44,975 | $7,000 | $37,975 |
| 2023 | $2,324 | $36,505 | $5,915 | $30,590 |
| 2022 | $2,326 | $36,505 | $5,915 | $30,590 |
| 2021 | $2,383 | $36,505 | $5,915 | $30,590 |
| 2020 | $2,245 | $30,275 | $4,935 | $25,340 |
| 2019 | $2,185 | $30,275 | $4,935 | $25,340 |
| 2018 | $2,036 | $30,275 | $4,935 | $25,340 |
| 2017 | $1,899 | $24,675 | $6,195 | $18,480 |
| 2016 | $1,897 | $70,500 | $17,700 | $52,800 |
| 2015 | $1,880 | $70,500 | $17,700 | $52,800 |
| 2014 | $1,555 | $24,680 | $6,200 | $18,480 |
| 2013 | $1,555 | $24,680 | $6,200 | $18,480 |
Source: Public Records
Map
Nearby Homes