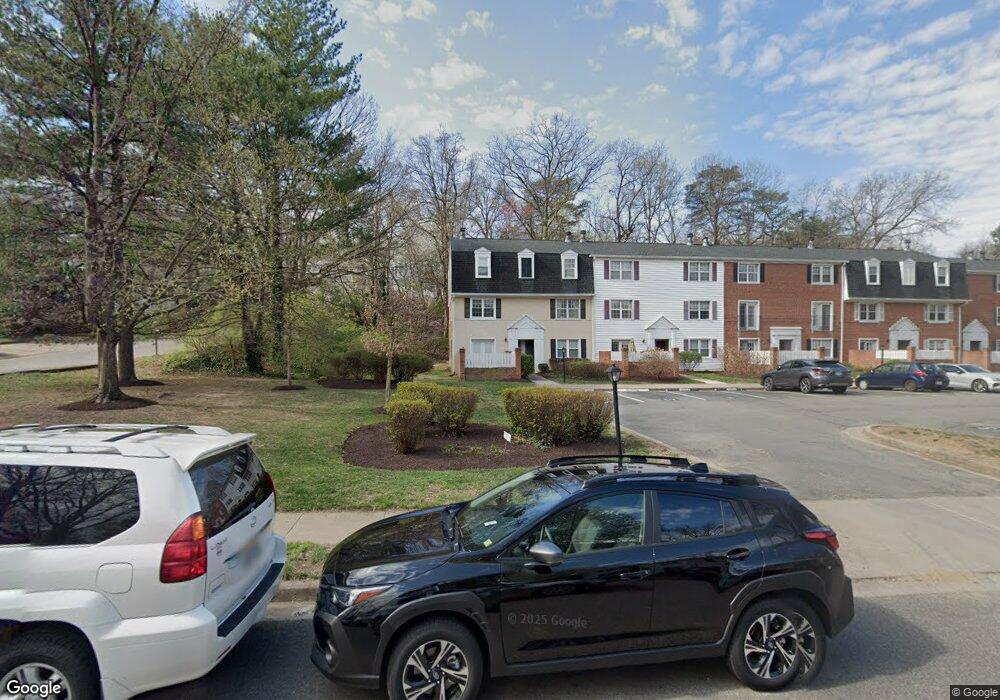
2852 S Wakefield St Unit A Arlington, VA 22206
Fairlington NeighborhoodEstimated Value: $396,761 - $448,000
2
Beds
1
Bath
810
Sq Ft
$517/Sq Ft
Est. Value
About This Home
This home is located at 2852 S Wakefield St Unit A, Arlington, VA 22206 and is currently estimated at $418,440, approximately $516 per square foot. 2852 S Wakefield St Unit A is a home located in Arlington County with nearby schools including Abingdon Elementary School, Gunston Middle School, and Wakefield High School.
Ownership History
Date
Name
Owned For
Owner Type
Purchase Details
Closed on
Sep 13, 2015
Sold by
Proctor Kathleen Suzanne
Bought by
Daza Rodolfo Valentinez and Palacio Denise E De Laet
Current Estimated Value
Home Financials for this Owner
Home Financials are based on the most recent Mortgage that was taken out on this home.
Original Mortgage
$289,750
Outstanding Balance
$227,812
Interest Rate
3.94%
Mortgage Type
New Conventional
Estimated Equity
$190,628
Purchase Details
Closed on
Jul 22, 2002
Sold by
Anderson Christine
Bought by
Proctor Kathleen
Home Financials for this Owner
Home Financials are based on the most recent Mortgage that was taken out on this home.
Original Mortgage
$194,550
Interest Rate
6.73%
Purchase Details
Closed on
Jul 12, 2000
Sold by
Sutton George M
Bought by
Anderson Christine
Home Financials for this Owner
Home Financials are based on the most recent Mortgage that was taken out on this home.
Original Mortgage
$112,300
Interest Rate
8.28%
Create a Home Valuation Report for This Property
The Home Valuation Report is an in-depth analysis detailing your home's value as well as a comparison with similar homes in the area
Home Values in the Area
Average Home Value in this Area
Purchase History
| Date | Buyer | Sale Price | Title Company |
|---|---|---|---|
| Daza Rodolfo Valentinez | $305,000 | None Available | |
| Proctor Kathleen | $194,550 | -- | |
| Anderson Christine | $112,300 | -- |
Source: Public Records
Mortgage History
| Date | Status | Borrower | Loan Amount |
|---|---|---|---|
| Open | Daza Rodolfo Valentinez | $289,750 | |
| Previous Owner | Proctor Kathleen | $194,550 | |
| Previous Owner | Anderson Christine | $112,300 |
Source: Public Records
Tax History Compared to Growth
Tax History
| Year | Tax Paid | Tax Assessment Tax Assessment Total Assessment is a certain percentage of the fair market value that is determined by local assessors to be the total taxable value of land and additions on the property. | Land | Improvement |
|---|---|---|---|---|
| 2025 | $4,002 | $387,400 | $62,400 | $325,000 |
| 2024 | $3,936 | $381,000 | $62,400 | $318,600 |
| 2023 | $3,860 | $374,800 | $62,400 | $312,400 |
| 2022 | $3,737 | $362,800 | $62,400 | $300,400 |
| 2021 | $3,676 | $356,900 | $62,400 | $294,500 |
| 2020 | $3,438 | $335,100 | $42,100 | $293,000 |
| 2019 | $3,165 | $308,500 | $42,100 | $266,400 |
| 2018 | $2,976 | $295,800 | $42,100 | $253,700 |
| 2017 | $2,831 | $281,400 | $42,100 | $239,300 |
| 2016 | $2,837 | $286,300 | $42,100 | $244,200 |
| 2015 | $2,852 | $286,300 | $42,100 | $244,200 |
| 2014 | $2,804 | $281,500 | $42,100 | $239,400 |
Source: Public Records
Map
Nearby Homes
- 2907 S Woodley St Unit C
- 4614 28th Rd S Unit B
- 2592 G S Arlington Mill Dr Unit 7
- 4619 28th Rd S Unit B
- 4619 28th Rd S Unit C
- 4617 28th Rd S Unit B
- 4519 28th Rd S Unit A
- 2505 S Walter Reed Dr Unit A
- 2540 S Walter Reed Dr Unit 4
- 4600 30th Rd S
- 2605 S Walter Reed Dr Unit A
- 3080 S Abingdon St Unit A1
- 2246 S Randolph St Unit 1
- 4836 29th St S Unit A1
- 2949 S Columbus St Unit A2
- 3050 S Buchanan St Unit A2
- 3017 S Columbus St Unit A1
- 2950 S Columbus St Unit C1
- 2990 S Columbus St
- 2842 S Columbus St
- 2852 S Wakefield St Unit C
- 2852 S Wakefield St Unit B
- 2852 S Wakefield St Unit A
- 2852 S Wakefield St Unit C
- 2852 S Wakefield St Unit B
- 2852 C S Wakefield St Unit C
- 2852 Wakefield Street C S Unit C
- 2852 Wakefield Street B S Unit B
- 2850 S Wakefield St Unit C
- 2850 S Wakefield St Unit B
- 2850 S Wakefield St Unit A
- 2850 S Wakefield St
- 2850 S Wakefield St Unit C
- 2846 Wakefield Street A Unit A
- 2846 Wakefield Street B S Unit B
- 2846 Wakefield Street C Unit C
- 2848 S Wakefield St Unit C
- 2848 S Wakefield St Unit C
- 2848 S Wakefield St Unit B
- 2848 S Wakefield St Unit A