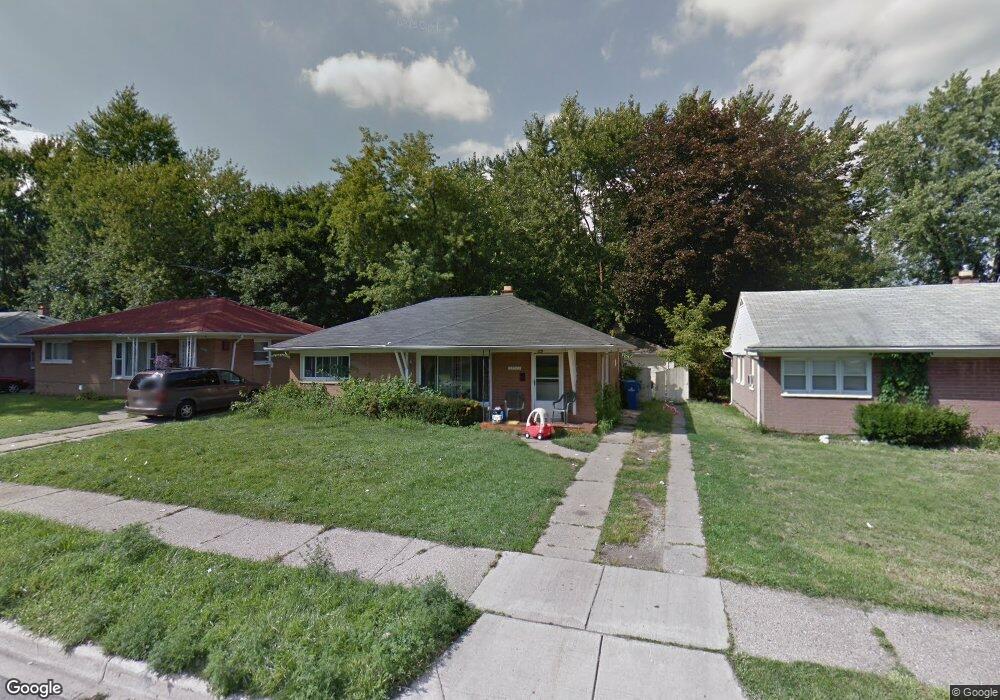
28522 Hazelwood St Inkster, MI 48141
Estimated Value: $110,000 - $138,721
3
Beds
1
Bath
1,092
Sq Ft
$117/Sq Ft
Est. Value
About This Home
This home is located at 28522 Hazelwood St, Inkster, MI 48141 and is currently estimated at $127,680, approximately $116 per square foot. 28522 Hazelwood St is a home located in Wayne County with nearby schools including American International Academy - Elementary, Inkster Preparatory Academy, and American International Academy.
Ownership History
Date
Name
Owned For
Owner Type
Purchase Details
Closed on
May 30, 2020
Sold by
Schkoor Karieem
Bought by
Hargrove Shalinda Lachelle
Current Estimated Value
Purchase Details
Closed on
Jul 7, 2008
Sold by
Mortgage Electronic Registration Systems
Bought by
Deutsche Bank Trust Co Americas
Purchase Details
Closed on
May 7, 2008
Sold by
Mckivens Michael
Bought by
Mortgage Electronic Registration Systems
Purchase Details
Closed on
Dec 28, 2006
Sold by
Lamar James
Bought by
Mckivens Michael
Purchase Details
Closed on
Sep 19, 2006
Sold by
First American Reo
Bought by
Lamar James
Purchase Details
Closed on
Aug 31, 2005
Sold by
Hall Dorothy
Bought by
Abn Amro Mortgage Group Inc
Purchase Details
Closed on
Apr 11, 1996
Sold by
Hall Dorothy
Bought by
Leonard Bale and Evans Bale Carol L
Create a Home Valuation Report for This Property
The Home Valuation Report is an in-depth analysis detailing your home's value as well as a comparison with similar homes in the area
Home Values in the Area
Average Home Value in this Area
Purchase History
| Date | Buyer | Sale Price | Title Company |
|---|---|---|---|
| Hargrove Shalinda Lachelle | -- | None Available | |
| Deutsche Bank Trust Co Americas | -- | E Title Agency | |
| Mortgage Electronic Registration Systems | $56,000 | None Available | |
| Mckivens Michael | $92,000 | Attorneys Title Agency Llc | |
| Lamar James | $54,400 | Attorneys Title Agency Llc | |
| Abn Amro Mortgage Group Inc | $90,853 | None Available | |
| Leonard Bale | $40,000 | -- |
Source: Public Records
Tax History Compared to Growth
Tax History
| Year | Tax Paid | Tax Assessment Tax Assessment Total Assessment is a certain percentage of the fair market value that is determined by local assessors to be the total taxable value of land and additions on the property. | Land | Improvement |
|---|---|---|---|---|
| 2025 | $1,778 | $52,500 | $0 | $0 |
| 2024 | $1,778 | $43,100 | $0 | $0 |
| 2023 | $1,835 | $35,300 | $0 | $0 |
| 2022 | $3,172 | $28,500 | $0 | $0 |
| 2021 | $3,856 | $26,600 | $0 | $0 |
| 2020 | $2,671 | $23,200 | $0 | $0 |
| 2019 | $2,609 | $19,100 | $0 | $0 |
| 2018 | $1,486 | $17,100 | $0 | $0 |
| 2017 | $1,269 | $16,800 | $0 | $0 |
| 2016 | $2,251 | $15,600 | $0 | $0 |
| 2015 | $1,490 | $14,900 | $0 | $0 |
| 2013 | $2,110 | $21,100 | $0 | $0 |
| 2012 | $1,638 | $23,900 | $3,500 | $20,400 |
Source: Public Records
Map
Nearby Homes
- 28541 Glenwood St
- 28457 Oakwood St
- 28645 Glenwood St
- 28338 Parkwood St
- 1049 Woodland Dr
- 28148 Rosewood St
- 28993 Glenwood St
- 28058 Avondale St
- 0 Helen St
- 720 Magnolia Dr
- 1338 Helen St
- 1248 Colonial Dr
- 28930 Birchwood St
- 29142 Parkwood St
- 29118 Avondale St
- 27922 Rosewood St
- 1144 Center St
- 27848 Rosewood St
- 29221 Barrington St
- 27817 Rosewood St
- 28532 Hazelwood St
- 28510 Hazelwood St
- 28544 Hazelwood St
- 28500 Hazelwood St
- 28554 Hazelwood St
- 28525 Glenwood St
- 28517 Glenwood St
- 28533 Glenwood St
- 28509 Glenwood St
- 28483 Glenwood St
- 28515 Hazelwood St
- 28549 Glenwood St
- 28525 Hazelwood St
- 28488 Hazelwood St
- 28535 Hazelwood St
- 28475 Glenwood St
- 28566 Hazelwood St
- 28613 Glenwood St
- 28491 Hazelwood St
- 28467 Glenwood St