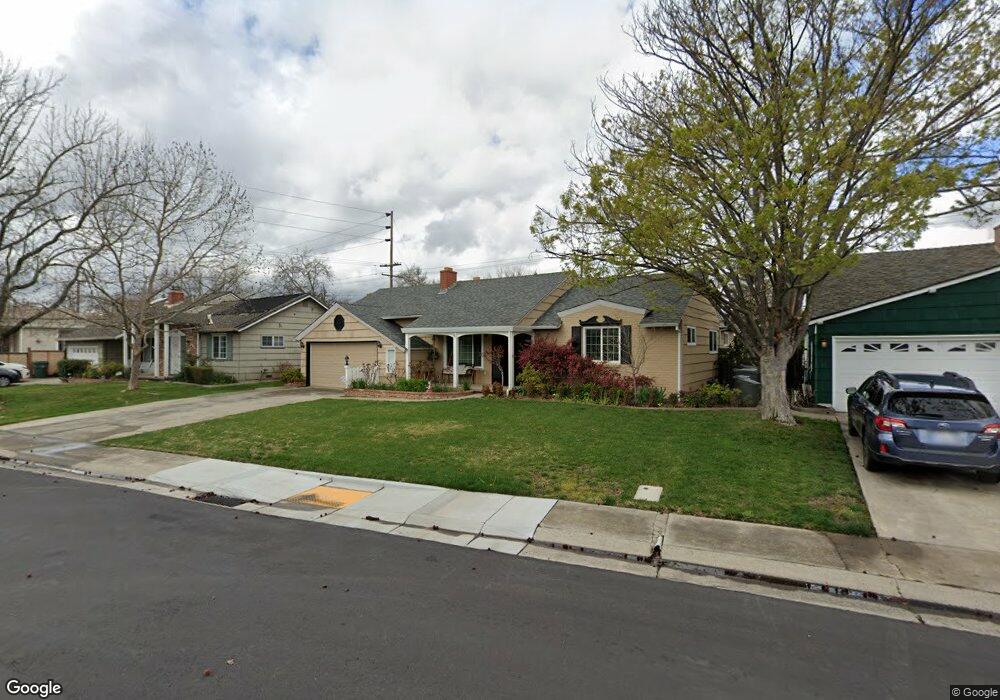
2855 El Prado Way Sacramento, CA 95825
Cottage Park NeighborhoodEstimated Value: $486,000 - $600,000
4
Beds
2
Baths
1,852
Sq Ft
$282/Sq Ft
Est. Value
About This Home
This home is located at 2855 El Prado Way, Sacramento, CA 95825 and is currently estimated at $521,416, approximately $281 per square foot. 2855 El Prado Way is a home located in Sacramento County with nearby schools including Cottage Elementary School, Encina Preparatory High School, and Aspire Alexander Twilight College Preparatory Academy.
Ownership History
Date
Name
Owned For
Owner Type
Purchase Details
Closed on
Feb 24, 2020
Sold by
Farnham Grace
Bought by
Farnham Grace Caroline and The Doyle Louis Farnham Family
Current Estimated Value
Purchase Details
Closed on
Jul 12, 2010
Sold by
Onewest Bank Fsb
Bought by
Farnham Grace
Purchase Details
Closed on
Apr 1, 2010
Sold by
Mouras Belton
Bought by
Onewest Bank Fsb
Purchase Details
Closed on
Nov 5, 2003
Sold by
Back William F and Custer Back Revocable Trust
Bought by
Mouras Belton
Home Financials for this Owner
Home Financials are based on the most recent Mortgage that was taken out on this home.
Original Mortgage
$220,000
Interest Rate
5.94%
Mortgage Type
Purchase Money Mortgage
Purchase Details
Closed on
May 4, 1995
Sold by
Weisker Back Janet Ruth Weisker and Weisker Back Ruth Janet
Bought by
Back Custer
Purchase Details
Closed on
Apr 19, 1995
Sold by
Back Custer
Bought by
Back Custer
Create a Home Valuation Report for This Property
The Home Valuation Report is an in-depth analysis detailing your home's value as well as a comparison with similar homes in the area
Home Values in the Area
Average Home Value in this Area
Purchase History
| Date | Buyer | Sale Price | Title Company |
|---|---|---|---|
| Farnham Grace Caroline | -- | None Available | |
| Farnham Grace | $196,000 | Fidelity National Title Co | |
| Onewest Bank Fsb | $232,324 | Accommodation | |
| Mouras Belton | $255,000 | Fidelity National Title Co | |
| Back Custer | -- | -- | |
| Back Custer | -- | -- |
Source: Public Records
Mortgage History
| Date | Status | Borrower | Loan Amount |
|---|---|---|---|
| Previous Owner | Mouras Belton | $220,000 |
Source: Public Records
Tax History Compared to Growth
Tax History
| Year | Tax Paid | Tax Assessment Tax Assessment Total Assessment is a certain percentage of the fair market value that is determined by local assessors to be the total taxable value of land and additions on the property. | Land | Improvement |
|---|---|---|---|---|
| 2025 | $2,941 | $251,097 | $54,956 | $196,141 |
| 2024 | $2,941 | $246,175 | $53,879 | $192,296 |
| 2023 | $2,864 | $241,349 | $52,823 | $188,526 |
| 2022 | $2,846 | $236,618 | $51,788 | $184,830 |
| 2021 | $2,797 | $231,979 | $50,773 | $181,206 |
| 2020 | $2,743 | $229,601 | $50,253 | $179,348 |
| 2019 | $2,686 | $225,100 | $49,268 | $175,832 |
| 2018 | $2,649 | $220,687 | $48,302 | $172,385 |
| 2017 | $2,624 | $216,360 | $47,355 | $169,005 |
| 2016 | $2,452 | $212,119 | $46,427 | $165,692 |
| 2015 | $2,408 | $208,934 | $45,730 | $163,204 |
| 2014 | $2,356 | $204,843 | $44,835 | $160,008 |
Source: Public Records
Map
Nearby Homes
- 2113 Weldon Way
- 2822 Sweet Way
- 2808 Sweet Way
- 2108 Tevis Rd
- 2519 Castlewood Dr
- 2132 Byron Rd
- 2416 Wulff Ln
- 2433 Gwen Dr
- 2727 Lacy Ln
- 1911 Terrace Dr
- 2730 Idlewood Ln
- 3223 Via Grande
- 2410 Post Oak Ln
- 2356 Wyda Way
- 2001 Woodstock Way
- 2350 Wyda Way
- 2380 Alta Garden Ln Unit A
- 2362 Alta Garden Ln Unit B
- 2350 Alta Garden Ln Unit B
- 3546 Cody Way
- 2851 El Prado Way
- 2859 El Prado Way
- 2818 Merrywood Dr
- 2812 Merrywood Dr
- 2863 El Prado Way
- 2824 Merrywood Dr
- 2850 El Prado Way
- 2232 Weldon Way
- 2806 Merrywood Dr
- 2867 El Prado Way
- 2830 Merrywood Dr
- 2864 El Prado Way
- 2300 Parkwood Dr
- 2228 Weldon Way
- 2901 El Prado Way
- 2836 Merrywood Dr
- 2229 Landon Ln
- 2225 Weldon Way
- 2819 Merrywood Dr
- 2224 Weldon Way