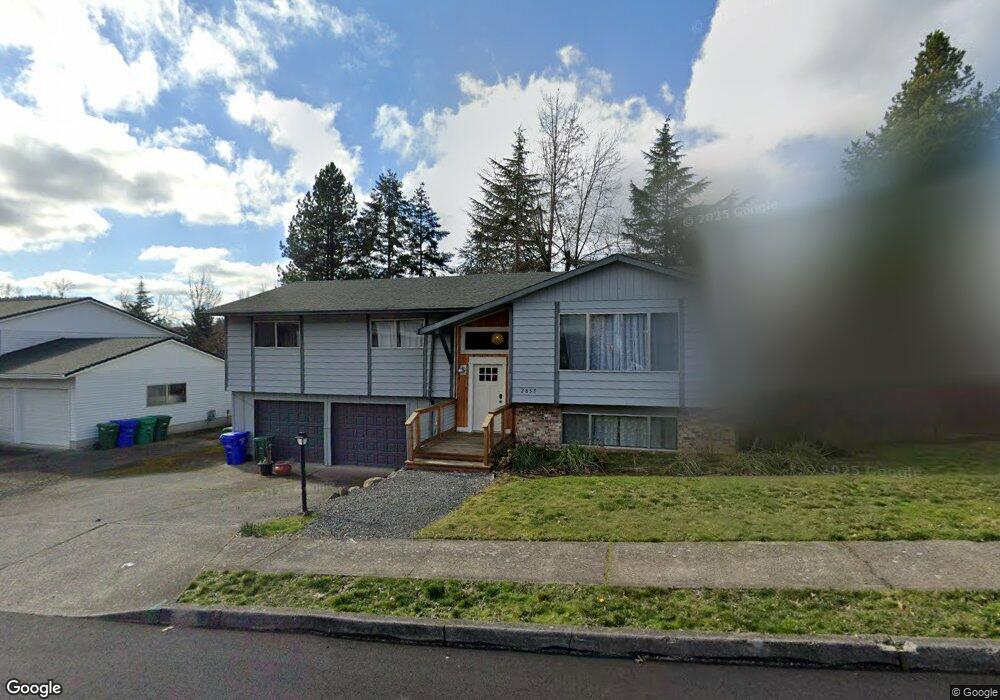
2855 SW Angeline Ave Gresham, OR 97080
Southwest Gresham NeighborhoodEstimated Value: $500,000 - $557,000
3
Beds
3
Baths
2,395
Sq Ft
$225/Sq Ft
Est. Value
About This Home
This home is located at 2855 SW Angeline Ave, Gresham, OR 97080 and is currently estimated at $538,227, approximately $224 per square foot. 2855 SW Angeline Ave is a home located in Multnomah County with nearby schools including Dexter McCarty Middle School, Gresham High School, and Portland Adventist Elementary School.
Ownership History
Date
Name
Owned For
Owner Type
Purchase Details
Closed on
Jun 10, 2021
Sold by
Krueger Katie Anne
Bought by
Krueger Joseph
Current Estimated Value
Purchase Details
Closed on
Jun 17, 2016
Sold by
Northrup John
Bought by
Krueger Joseph and Krueger Katie Anne
Home Financials for this Owner
Home Financials are based on the most recent Mortgage that was taken out on this home.
Original Mortgage
$261,180
Outstanding Balance
$207,578
Interest Rate
3.61%
Mortgage Type
New Conventional
Estimated Equity
$330,649
Purchase Details
Closed on
Jul 18, 1997
Sold by
Wold Arthur Kenneth
Bought by
Northrup John and Northrup Debra G
Home Financials for this Owner
Home Financials are based on the most recent Mortgage that was taken out on this home.
Original Mortgage
$146,750
Interest Rate
7.83%
Mortgage Type
Purchase Money Mortgage
Create a Home Valuation Report for This Property
The Home Valuation Report is an in-depth analysis detailing your home's value as well as a comparison with similar homes in the area
Home Values in the Area
Average Home Value in this Area
Purchase History
We collect this data history from publicly available records. To have your information removed, we recommend requesting removal directly through your county’s website.
| Date | Buyer | Sale Price | Title Company |
|---|---|---|---|
| Krueger Joseph | -- | Lawyers | |
| Krueger Joseph | $290,200 | First American | |
| Northrup John | $154,500 | Ticor Title Insurance |
Source: Public Records
Mortgage History
We collect this data history from publicly available records. To have your information removed, we recommend requesting removal directly through your county’s website.
| Date | Status | Borrower | Loan Amount |
|---|---|---|---|
| Open | Krueger Joseph | $261,180 | |
| Previous Owner | Northrup John | $146,750 |
Source: Public Records
Tax History
| Year | Tax Paid | Tax Assessment Tax Assessment Total Assessment is a certain percentage of the fair market value that is determined by local assessors to be the total taxable value of land and additions on the property. | Land | Improvement |
|---|---|---|---|---|
| 2025 | $6,679 | $328,200 | -- | -- |
| 2024 | $6,393 | $318,650 | -- | -- |
| 2023 | $5,825 | $309,370 | $0 | $0 |
| 2022 | $5,662 | $300,360 | $0 | $0 |
| 2021 | $5,519 | $291,620 | $0 | $0 |
| 2020 | $5,193 | $283,130 | $0 | $0 |
| 2019 | $5,057 | $274,890 | $0 | $0 |
| 2018 | $4,822 | $266,890 | $0 | $0 |
| 2017 | $4,626 | $259,120 | $0 | $0 |
| 2016 | $4,079 | $251,580 | $0 | $0 |
| 2015 | $3,991 | $244,260 | $0 | $0 |
| 2014 | $3,894 | $237,150 | $0 | $0 |
Source: Public Records
Map
Nearby Homes
- 1278 SW 27th Ct
- 1320 SW 31st St
- 2331 SW 27th Dr
- 2068 SW 34th St
- 1363 SW Binford Lake Pkwy
- 1261 SW Binford Lake Pkwy
- 1721 SW Butler Rd
- 2188 SW Binford Lake Pkwy
- 1944 SW 20th Ct
- 2791 SW Myers Dr
- 2650 SW 22nd Ct
- 2715 SW 31st St
- 3511 SW Eleven Mile Ave
- 3533 SW Eleven Mile Ave
- 3555 SW Eleven Mile Ave
- 3577 SW Eleven Mile Ave
- 3512 SW Battaglia Ave
- 3619 SW Eleven Mile Ave
- 3503 SW Battaglia Ave
- 3582 SW Battaglia Ave
- 1862 SW 27th Dr
- 2895 SW Angeline Ave
- 2862 SW Willowbrook Ct
- 1790 SW 27th St
- 2790 SW Angeline Ct
- 2890 SW Angeline Ave
- 1892 SW 27th Dr
- 2925 SW Angeline Ave
- 1855 SW 29th Dr
- 2821 SW Willowbrook Ct
- 2918 SW Angeline Ave
- 2795 SW Angeline Ct
- 2882 SW Willowbrook Ct
- 1915 SW 27th Dr
- 1915 SW 27th St
- 1932 SW 27th Dr
- 1740 SW 27th St
- 1725 SW 29th Ct
- 2740 SW Angeline Ct
- 2851 SW Willowbrook Ct
Your Personal Tour Guide
Ask me questions while you tour the home.