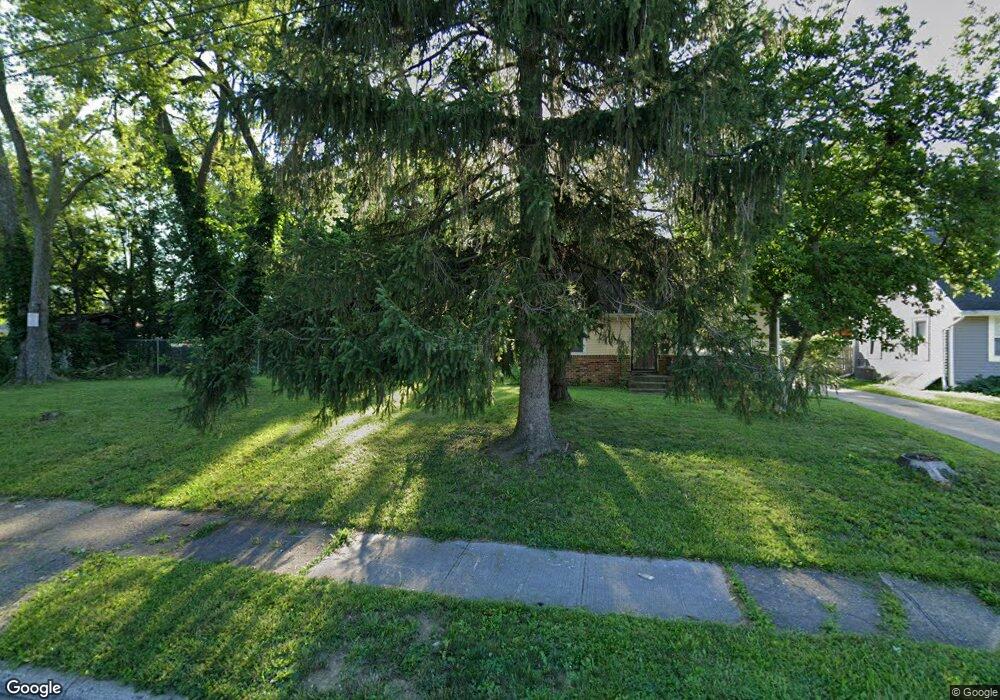
2856 Linview Ave Columbus, OH 43211
East Linden NeighborhoodEstimated Value: $43,000 - $409,000
3
Beds
1
Bath
914
Sq Ft
$185/Sq Ft
Est. Value
About This Home
This home is located at 2856 Linview Ave, Columbus, OH 43211 and is currently estimated at $169,000, approximately $184 per square foot. 2856 Linview Ave is a home located in Franklin County with nearby schools including Linden STEM Academy (K-6), Linden-Mckinley Stem School On Arcadia, and Focus Learning Academy of Central Columbus.
Ownership History
Date
Name
Owned For
Owner Type
Purchase Details
Closed on
Oct 4, 2020
Sold by
Central Ohio Community Improvemnent Corp
Bought by
Brown Sheryl J
Current Estimated Value
Purchase Details
Closed on
Jan 10, 2019
Sold by
Little This Little That Llc
Bought by
Central Ohio Community Improvement Corp
Purchase Details
Closed on
Sep 25, 2015
Sold by
Columbus Federal Creidt Union
Bought by
Little This Little That Llc
Purchase Details
Closed on
Feb 17, 2015
Sold by
Mills Patricia and Crockett Patricia
Bought by
Columbus Metro Fcu
Purchase Details
Closed on
Oct 23, 1975
Bought by
Mills Patricia
Create a Home Valuation Report for This Property
The Home Valuation Report is an in-depth analysis detailing your home's value as well as a comparison with similar homes in the area
Home Values in the Area
Average Home Value in this Area
Purchase History
| Date | Buyer | Sale Price | Title Company |
|---|---|---|---|
| Brown Sheryl J | -- | None Available | |
| Central Ohio Community Improvement Corp | -- | None Available | |
| Little This Little That Llc | -- | Monarch Title Agency Inc | |
| Columbus Metro Fcu | $16,000 | None Available | |
| Mills Patricia | -- | -- |
Source: Public Records
Tax History
| Year | Tax Paid | Tax Assessment Tax Assessment Total Assessment is a certain percentage of the fair market value that is determined by local assessors to be the total taxable value of land and additions on the property. | Land | Improvement |
|---|---|---|---|---|
| 2025 | $11 | $250 | $250 | -- |
| 2024 | $11 | $250 | $250 | -- |
| 2023 | $30 | $250 | $250 | $0 |
| 2022 | $27 | $210 | $210 | $0 |
| 2021 | $0 | $210 | $210 | $0 |
| 2020 | $0 | $210 | $210 | $0 |
| 2019 | $1,789 | $360 | $180 | $180 |
| 2018 | $871 | $360 | $180 | $180 |
| 2017 | $1,001 | $3,850 | $1,960 | $1,890 |
| 2016 | $1,180 | $14,350 | $2,380 | $11,970 |
| 2015 | $864 | $14,350 | $2,380 | $11,970 |
| 2014 | $890 | $14,350 | $2,380 | $11,970 |
| 2013 | $590 | $16,870 | $2,800 | $14,070 |
Source: Public Records
Map
Nearby Homes
- 2068 Agler Rd
- 2823 Fern Ave
- 2735 Berrell Ave
- 2765 Joyce Ave
- 2861 Woodland Ave
- 1877 Robert St
- 2699 Woodland Ave
- 3001 Woodland Ave
- 1980 Oakland Park Ave
- 1884 E North Broadway St
- 3137 Westerville Rd Unit 4
- 3137 Westerville Rd Unit 91
- 1841 E North Broadway St
- 1884 Aberdeen Ave
- 3049 Cleveland Ave
- 1827 Aberdeen Ave
- 2480 Parkwood Ave
- 2475 Parkwood Ave
- 1326 Minnesota Ave
- 2927 Poolside Dr Unit 10
- 2848 Linview Ave
- 2093 Agler Rd
- 2099 Agler Rd
- 2842 Linview Ave
- 2836 Linview Ave
- 2113 Agler Rd
- 2105 Agler Rd
- 2865 Linview Ave
- 2853 Linview Ave
- 2845 Linview Ave
- 2119 Agler Rd
- 2839 Linview Ave
- 2843 Berrell Ave
- 2833 Linview Ave
- 2822 Linview Ave
- 2835 Berrell Ave
- 2829 Berrell Ave
- 2829 Linview Ave
- 2076 Agler Rd
- 2137 Agler Rd
Your Personal Tour Guide
Ask me questions while you tour the home.