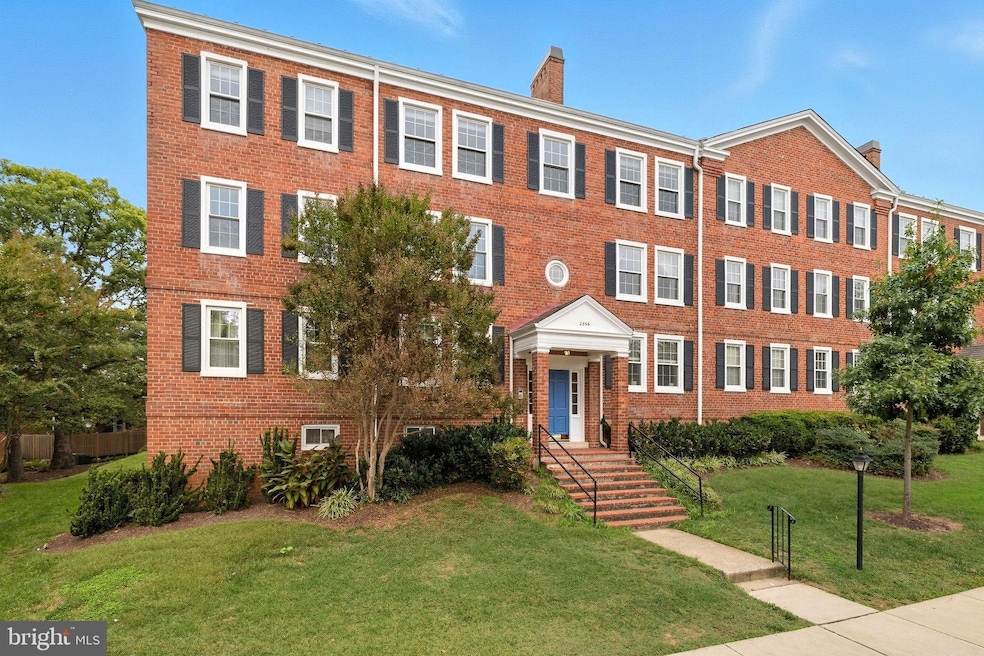
2856 S Buchanan St Unit B1 Arlington, VA 22206
Fairlington NeighborhoodHighlights
- View of Trees or Woods
- Colonial Architecture
- Heated Community Pool
- Gunston Middle School Rated A-
- Traditional Floor Plan
- Tennis Courts
About This Home
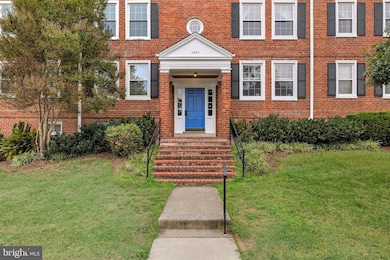
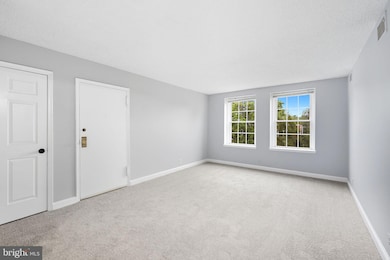
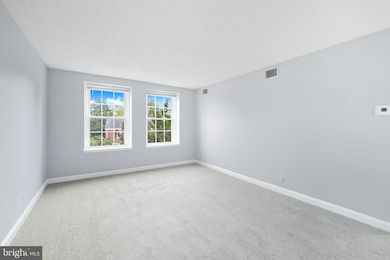
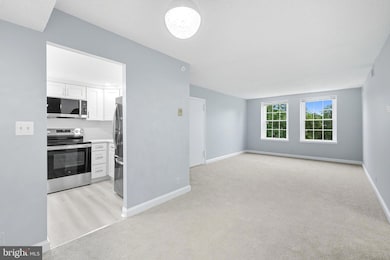
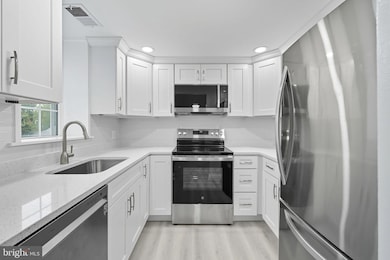
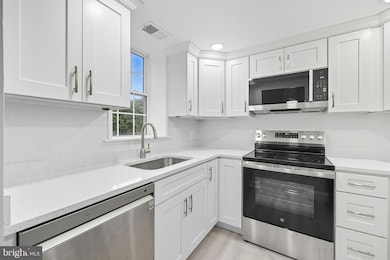
Welcome to historic Fairlington, a fantastic community with character. This home is fully renovated and ready for a tenant looking for that new-home feel. A brand new kitchen features new luxury-vinyl tile floors, quartz countertops, white shaker cabinets and shiny, stainless-steel appliances, while a new bath showcases a stylish vanity, new tile floors, and a modern feel with white-quartz countertops brightened by a stunning mirror and overhead, light fixture. New carpet and fresh paint run throughout the spacious floor plan, which also provides for wonderful natural from three directions with the home's position on the end of the building. features a spacious floor plan with great natural light and backs to trees and community pool. The living room and bedrooms provide ample space for furniture arrangements. This home has convenient access to Metrobus (less than a block) and connects with the Pentagon City and Pentagon Metro Stations, allowing for for a quick commute into the District and several other destinations, including Mark Center, Old Town Alexandria, and other parts of Arlington. Nearby and walkable Shirlington Village, Alexandria Gateway, and Bradlee Center provide multiple options for shopping, entertainment, enrichment, and dining any time of day. This home is also convenient to several bike/walk and nature trails. Available immediately!
Listing Agent
(703) 402-4648 cweathers@ttrsir.com TTR Sotheby's International Realty License #0225201978 Listed on: 10/01/2025

Condo Details
Home Type
- Condominium
Est. Annual Taxes
- $4,046
Year Built
- Built in 1944 | Remodeled in 2025
Lot Details
- 1 Common Wall
- East Facing Home
- Historic Home
- Property is in excellent condition
Property Views
- Woods
- Courtyard
Home Design
- Colonial Architecture
- Entry on the 2nd floor
- Brick Exterior Construction
- Slate Roof
Interior Spaces
- Property has 1 Level
- Traditional Floor Plan
- Recessed Lighting
- Double Pane Windows
- Insulated Windows
- Double Hung Windows
- Combination Dining and Living Room
- Storage Room
- Wall to Wall Carpet
- Intercom
Kitchen
- Galley Kitchen
- Electric Oven or Range
- Dishwasher
- Disposal
Bedrooms and Bathrooms
- 2 Main Level Bedrooms
- 1 Full Bathroom
- Bathtub with Shower
Laundry
- Laundry in unit
- Stacked Washer and Dryer
Partially Finished Basement
- Interior Basement Entry
- Basement with some natural light
Parking
- 2 Open Parking Spaces
- 1 Parking Space
- On-Street Parking
- Parking Lot
- Off-Street Parking
- Surface Parking
- Parking Permit Included
Schools
- Abingdon Elementary School
- Gunston Middle School
- Wakefield High School
Utilities
- Forced Air Heating and Cooling System
- Heat Pump System
- Electric Water Heater
Additional Features
- Energy-Efficient Windows
- Balcony
- Suburban Location
Listing and Financial Details
- Residential Lease
- Security Deposit $2,500
- Rent includes grounds maintenance, hoa/condo fee, parking, sewer, snow removal, trash removal, water
- No Smoking Allowed
- 12-Month Min and 24-Month Max Lease Term
- Available 10/1/25
- $50 Application Fee
- Assessor Parcel Number 29-007-759
Community Details
Overview
- Property has a Home Owners Association
- Association fees include common area maintenance, exterior building maintenance, management, parking fee, pool(s), recreation facility, sewer, snow removal, trash, water
- $125 Other One-Time Fees
- 6 Units
- Low-Rise Condominium
- Fairlington Villages Condos
- Fairlington Villages Subdivision, Richmond Floorplan
- Fairlington Villages Community
Amenities
- Picnic Area
- Common Area
Recreation
- Tennis Courts
- Community Basketball Court
- Community Playground
- Heated Community Pool
- Lap or Exercise Community Pool
- Jogging Path
Pet Policy
- No Pets Allowed
Security
- Security Service
Map
Source: Bright MLS
MLS Number: VAAR2064484
APN: 29-007-759
Disclaimer: Certain information contained herein is derived from information provided by parties other than Homes.com. All information provided is deemed reliable, but is not guaranteed to be accurate and should be independently verified.
![]() The data relating to real estate for sale on this website appears in part through the BRIGHT Internet Data Exchange program, a voluntary cooperative exchange of property listing data between licensed real estate brokerage firms, and is provided by BRIGHT through a licensing agreement.
The data relating to real estate for sale on this website appears in part through the BRIGHT Internet Data Exchange program, a voluntary cooperative exchange of property listing data between licensed real estate brokerage firms, and is provided by BRIGHT through a licensing agreement.
Listing information is from various brokers who participate in the Bright MLS IDX program and not all listings may be visible on the site.
The property information being provided on or through the website is for the personal, non-commercial use of consumers and such information may not be used for any purpose other than to identify prospective properties consumers may be interested in purchasing.
Some properties which appear for sale on the website may no longer be available because they are for instance, under contract, sold or are no longer being offered for sale.
Property information displayed is deemed reliable but is not guaranteed.
Copyright 2025 Bright MLS, Inc.
- 4894 28th St S
- 4836 29th St S Unit A1
- 4879 28th St S Unit A
- 4825 27th Rd S
- 2949 S Columbus St Unit A2
- 2659 S Walter Reed Dr Unit C
- 2605 S Walter Reed Dr Unit A
- 2950 S Columbus St Unit C1
- 2942 S Columbus St Unit A2
- 2990 S Columbus St
- 4644 28th Rd S Unit C
- 4520 King St Unit 601
- 2879 S Abingdon St
- 4706 30th St S Unit 2153
- 4710 30th St S Unit C1
- 4628 28th Rd S Unit A
- 4623 28th Rd S Unit C
- 4800 30th St S
- 3101 N Hampton Dr Unit 407
- 4619 28th Rd S Unit C
- 4860 28th St S Unit B1
- 4811 29th St S Unit A2
- 2822 S Buchanan St
- 2927 S Dinwiddie St
- 2836 S Abingdon St
- 2741 S Buchanan St
- 2930 S Buchanan St Unit C2
- 2932 S Buchanan St Unit B2
- 2659 S Walter Reed Dr Unit C
- 2960 S Columbus St Unit B2
- 4657 28th Rd S Unit A
- 4655 28th Rd S Unit A
- 4390 King St
- 3008 S Abingdon St Unit C2
- 4520 King St Unit 709
- 3101 N Hampton Dr Unit 911
- 3101 N Hampton Dr Unit 1504
- 3101 N Hampton Dr Unit 202
- 3101 N Hampton Dr Unit 1419
- 3101 N Hampton Dr Unit 1009