28585 W Fox River Dr Barrington, IL 60010
West Lake Barrington NeighborhoodEstimated Value: $183,393 - $322,000
--
Bed
1
Bath
858
Sq Ft
$331/Sq Ft
Est. Value
About This Home
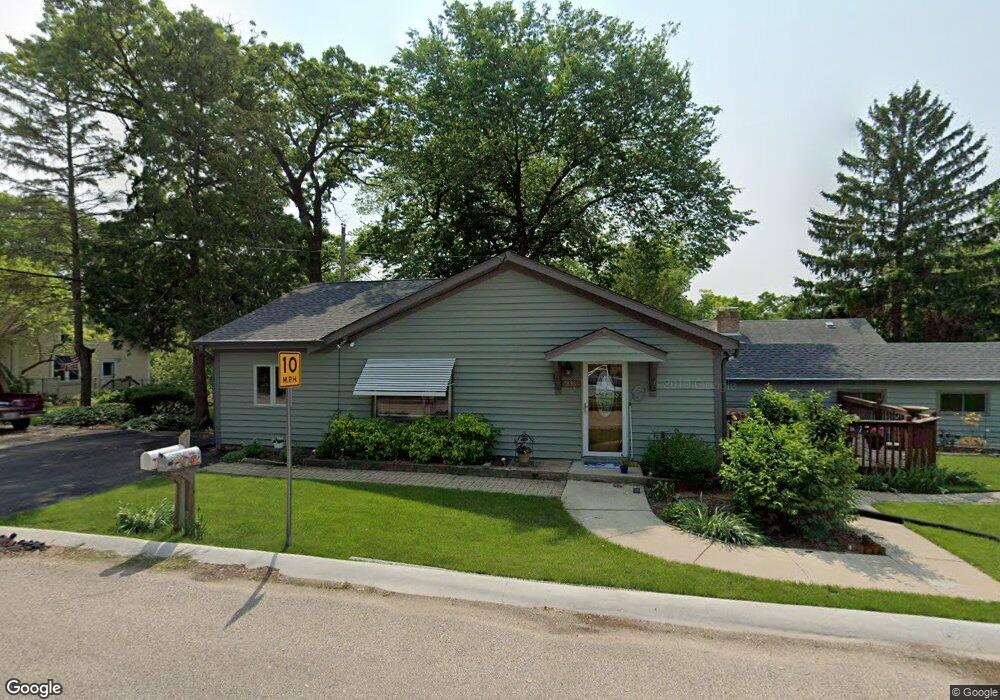
This home is located at 28585 W Fox River Dr, Barrington, IL 60010 and is currently estimated at $283,848, approximately $330 per square foot. 28585 W Fox River Dr is a home located in Lake County with nearby schools including Roslyn Road Elementary School, Barrington Middle School Station Campus, and Barrington High School.
Ownership History
Date
Name
Owned For
Owner Type
Purchase Details
Closed on
Oct 6, 2021
Sold by
Orr Gail Ann
Bought by
Orr Gail Ann and Gail Ann Orr Living Trust
Current Estimated Value
Purchase Details
Closed on
Sep 23, 2002
Sold by
Zimmerman Darrin J and Zimmerman Heidi I
Bought by
Orr Gail A
Home Financials for this Owner
Home Financials are based on the most recent Mortgage that was taken out on this home.
Original Mortgage
$152,000
Interest Rate
4.37%
Mortgage Type
Purchase Money Mortgage
Purchase Details
Closed on
Feb 22, 1999
Sold by
De Huck Debra J and De Carol A Zimmerman Revocable
Bought by
Zimmerman Darrin J and Zimmerman Heidi I
Home Financials for this Owner
Home Financials are based on the most recent Mortgage that was taken out on this home.
Original Mortgage
$56,200
Interest Rate
6.83%
Purchase Details
Closed on
Apr 30, 1998
Sold by
Home State Bank National Assn
Bought by
Zimmerman Carol A and The Carol A Zimmerman Revocabl
Create a Home Valuation Report for This Property
The Home Valuation Report is an in-depth analysis detailing your home's value as well as a comparison with similar homes in the area
Home Values in the Area
Average Home Value in this Area
Purchase History
| Date | Buyer | Sale Price | Title Company |
|---|---|---|---|
| Orr Gail Ann | -- | None Listed On Document | |
| Orr Gail A | $190,000 | Chicago Title Insurance Co | |
| Zimmerman Darrin J | $72,000 | -- | |
| Zimmerman Carol A | -- | -- |
Source: Public Records
Mortgage History
| Date | Status | Borrower | Loan Amount |
|---|---|---|---|
| Previous Owner | Orr Gail A | $152,000 | |
| Previous Owner | Zimmerman Darrin J | $56,200 |
Source: Public Records
Tax History Compared to Growth
Tax History
| Year | Tax Paid | Tax Assessment Tax Assessment Total Assessment is a certain percentage of the fair market value that is determined by local assessors to be the total taxable value of land and additions on the property. | Land | Improvement |
|---|---|---|---|---|
| 2024 | $2,319 | $47,161 | $5,953 | $41,208 |
| 2023 | $2,472 | $41,659 | $5,643 | $36,016 |
| 2022 | $2,472 | $42,133 | $6,384 | $35,749 |
| 2021 | $2,428 | $41,416 | $6,275 | $35,141 |
| 2020 | $2,362 | $41,288 | $6,256 | $35,032 |
| 2019 | $2,261 | $40,199 | $6,091 | $34,108 |
| 2018 | $2,302 | $41,944 | $6,304 | $35,640 |
| 2017 | $2,273 | $41,101 | $6,177 | $34,924 |
| 2016 | $2,210 | $39,551 | $5,944 | $33,607 |
| 2015 | $2,078 | $37,095 | $5,575 | $31,520 |
| 2014 | $2,219 | $37,741 | $6,566 | $31,175 |
| 2012 | $2,159 | $38,390 | $6,679 | $31,711 |
Source: Public Records
Map
Nearby Homes
- 23433 N Summit Dr
- 28629 W Ravine Dr
- 23490 N Spring Dr
- 28442 W Main St
- Lot 1 N Owl Ct
- 28876 W Pioneer Grove Rd
- 28740 W Bloners Dr
- 9209 Jasmine Way
- 24211 N Riverside Dr
- 23277 Enclave Ln
- 1034 Heather Ct
- 71 Flint Dr
- 911 Johnson St
- 806 Norge Pkwy
- 0000 Newbold Rd
- 902 Spring Beach Way
- Lot 7 Hickory Nut Grove Rd
- 28413 W Harvest Glen Cir
- 24744 N Golden Oat Cir
- 5 Jacqueline Ln
- 23391 N Summit Dr
- 23370 N Summit Dr
- 28586 W Fox River Dr
- 28590 W Fox River Dr
- 23377 N Summit Dr
- 23427 N Summit Dr
- 28598 W Fox River Dr
- 23362 N Summit Dr
- 23365 N Summit Dr
- 28608 W Fox River Dr
- 23441 N Summit Dr
- 28615 W Ravine Dr
- 23408 N East Dr
- 23392 N East Dr
- 23449 N Summit Dr
- 23378 N East Dr
- 28628 W Fox River Dr
- 28607 W North Dr
- 23434 N East Dr
- 28585 W North Dr