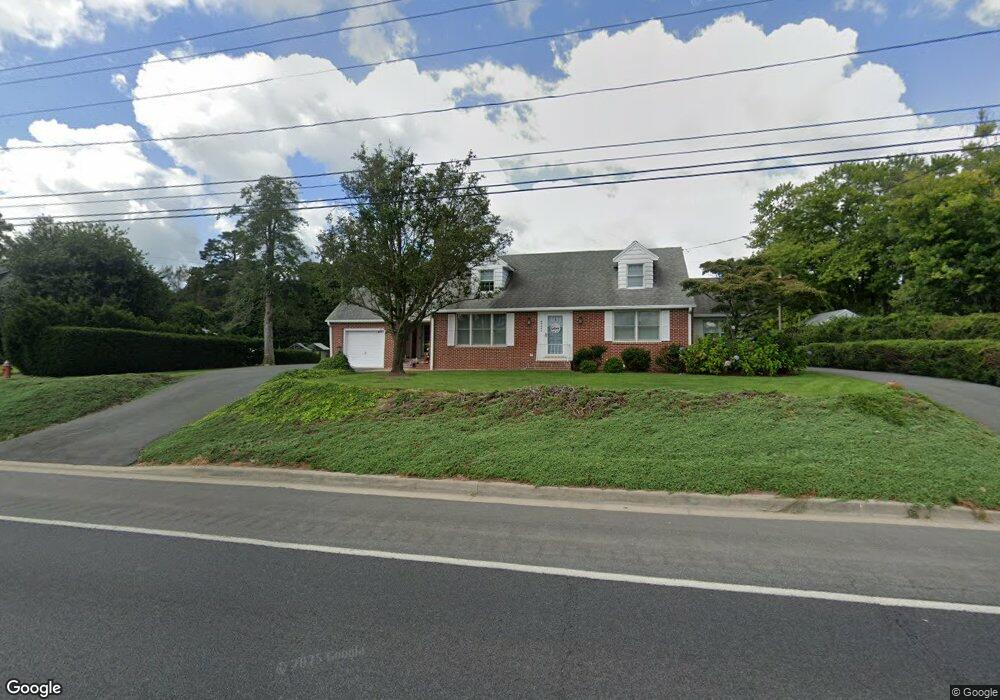
28588 Dupont Blvd Millsboro, DE 19966
Estimated Value: $333,229 - $441,000
4
Beds
3
Baths
2,900
Sq Ft
$135/Sq Ft
Est. Value
About This Home
This home is located at 28588 Dupont Blvd, Millsboro, DE 19966 and is currently estimated at $391,807, approximately $135 per square foot. 28588 Dupont Blvd is a home located in Sussex County with nearby schools including East Millsboro Elementary School, Millsboro Middle School, and Sussex Central High School.
Ownership History
Date
Name
Owned For
Owner Type
Purchase Details
Closed on
Mar 24, 2025
Sold by
Ricker Teresa B
Bought by
Ricker Jacob Charles
Current Estimated Value
Home Financials for this Owner
Home Financials are based on the most recent Mortgage that was taken out on this home.
Original Mortgage
$400,000
Outstanding Balance
$397,953
Interest Rate
6.87%
Mortgage Type
New Conventional
Estimated Equity
-$6,146
Purchase Details
Closed on
Aug 25, 2023
Sold by
Baker Vernon D and Ricker Teresa B
Bought by
Ricker Teresa B
Purchase Details
Closed on
Jul 6, 2020
Sold by
Baker Vernon D
Bought by
V D Sr & H W Baker Ret
Purchase Details
Closed on
Oct 18, 2019
Sold by
Vernon D Sr & H W Baker Ret
Bought by
Baker Vernon D
Purchase Details
Closed on
Oct 28, 2013
Sold by
Baker Veron D
Bought by
Baker Vernon D and Bakrer Harriet W
Create a Home Valuation Report for This Property
The Home Valuation Report is an in-depth analysis detailing your home's value as well as a comparison with similar homes in the area
Home Values in the Area
Average Home Value in this Area
Purchase History
| Date | Buyer | Sale Price | Title Company |
|---|---|---|---|
| Ricker Jacob Charles | -- | None Listed On Document | |
| Ricker Jacob Charles | -- | None Listed On Document | |
| Ricker Teresa B | -- | None Listed On Document | |
| Baker Vernon D | -- | None Listed On Document | |
| V D Sr & H W Baker Ret | -- | None Available | |
| Baker Vernon D | -- | -- | |
| Baker Vernon D | -- | -- |
Source: Public Records
Mortgage History
| Date | Status | Borrower | Loan Amount |
|---|---|---|---|
| Open | Ricker Jacob Charles | $400,000 | |
| Closed | Ricker Jacob Charles | $400,000 |
Source: Public Records
Tax History Compared to Growth
Tax History
| Year | Tax Paid | Tax Assessment Tax Assessment Total Assessment is a certain percentage of the fair market value that is determined by local assessors to be the total taxable value of land and additions on the property. | Land | Improvement |
|---|---|---|---|---|
| 2025 | $721 | $27,100 | $3,450 | $23,650 |
| 2024 | $1,121 | $27,100 | $3,450 | $23,650 |
| 2023 | $681 | $27,100 | $3,450 | $23,650 |
| 2022 | $656 | $27,100 | $3,450 | $23,650 |
| 2021 | $668 | $27,100 | $3,450 | $23,650 |
| 2020 | $631 | $27,100 | $3,450 | $23,650 |
| 2019 | $639 | $27,100 | $3,450 | $23,650 |
| 2018 | $649 | $27,100 | $0 | $0 |
| 2017 | $657 | $27,100 | $0 | $0 |
| 2016 | $573 | $27,100 | $0 | $0 |
| 2015 | $586 | $27,100 | $0 | $0 |
| 2014 | $571 | $27,100 | $0 | $0 |
Source: Public Records
Map
Nearby Homes
- 28592 Dupont Blvd
- 0 Cedar St
- 27003 Greenleaf Dr
- 29880 Plantation Dr Unit A22
- 27932 Home Farm Dr
- 30091 Plantation Dr Unit B4-5
- 30043 Plantation Dr
- 314 Derby Way
- 111 Irons Ave
- 612 Maidstone Ct
- Heather To-Be-Built Tbd
- 428 Tunbridge Ct
- 222 S Washington St
- 115 Alexandreas Ct Unit 8
- 129 Laurel Rd
- 28482 Dupont Blvd
- 402 Tunbridge Ct
- 108 Lauras Ct
- 429 Tunbridge Ct
- 196 Bobbys Branch Rd