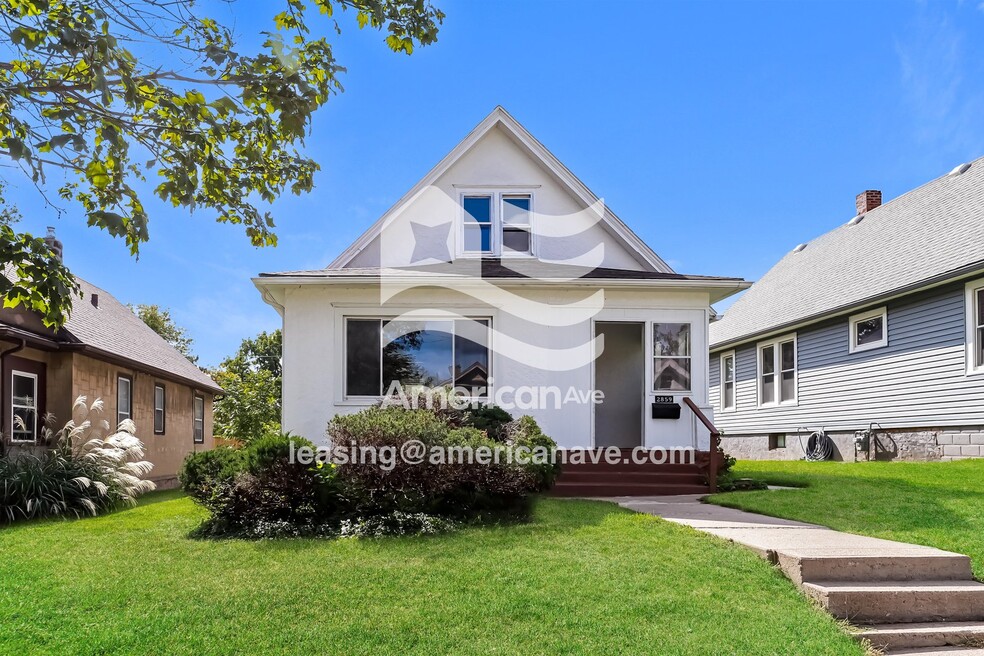
2859 Corby St Omaha, NE 68111
Lake-Bristol Square NeighborhoodAbout This Home
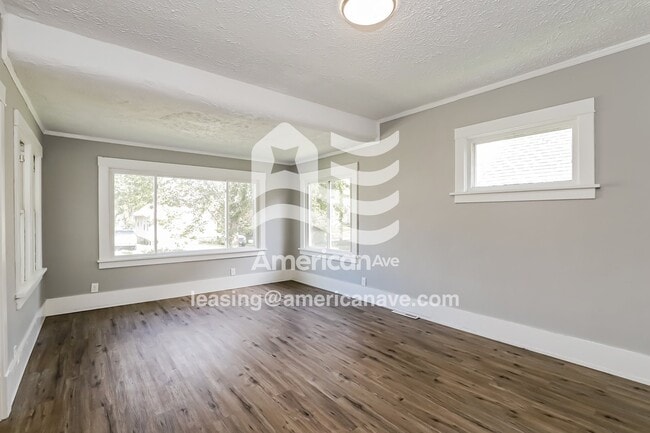
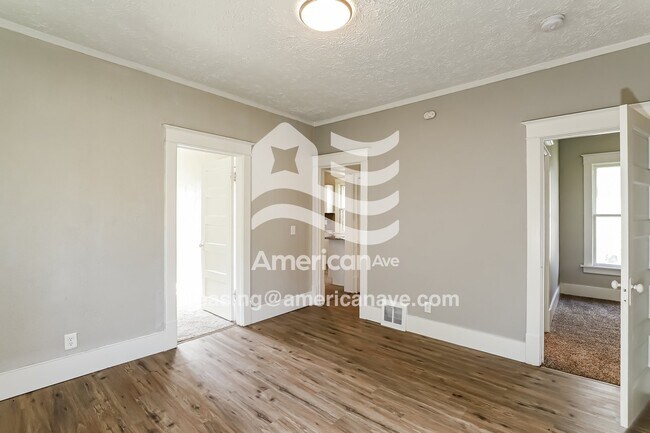
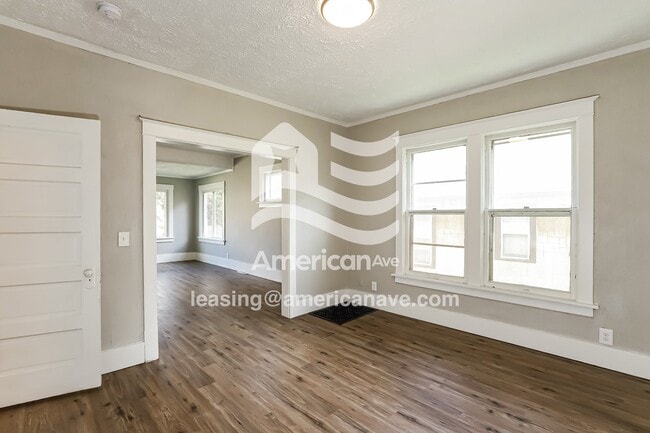
Now leasing: this professionally renovated 3-bedroom, 1-bath home on Corby St in the Catalpa Place subdivision of Omaha.
We are pet-friendly! Your dogs and cats are welcome at 2859 Corby Street.
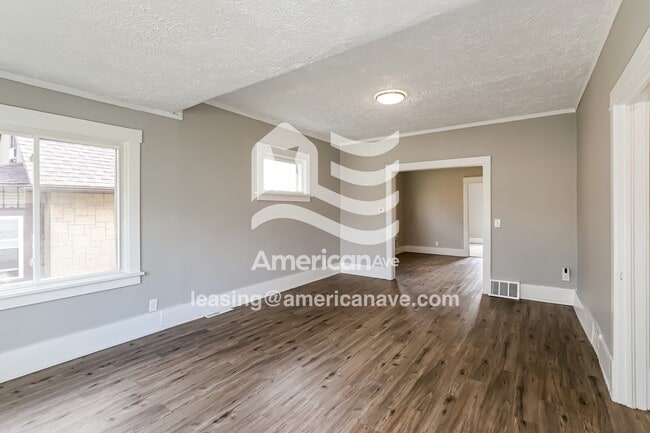
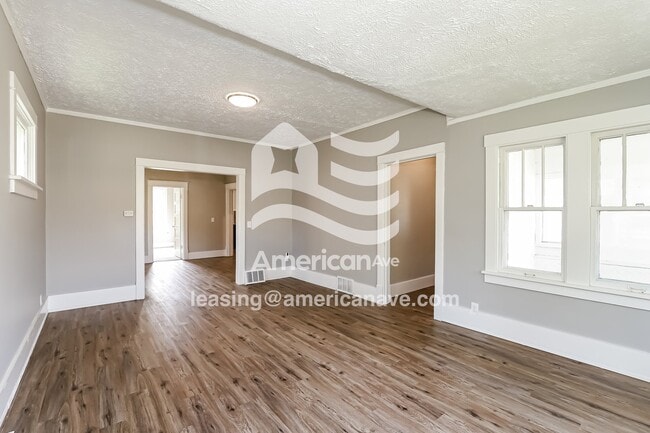
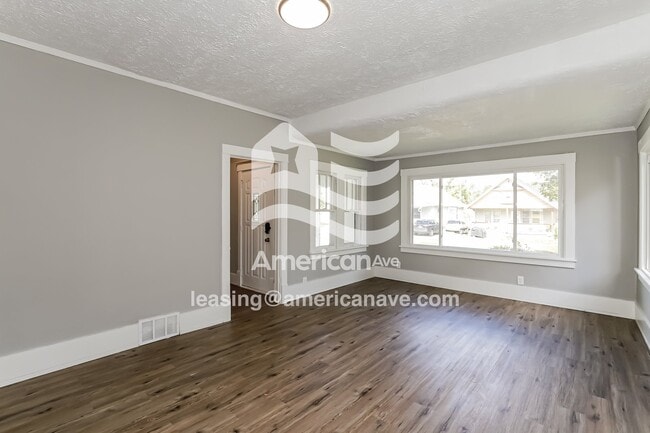
Benefit from recent upgrades in this inviting home. Essential appliances are included: whole-home Air Conditioning, refrigerator, an electric stove/oven, . The kitchen boasts modern granite/quartz countertops and washer/dryer hookups add convenience. Enjoy the sophisticated look of luxury vinyl plank flooring and the practicality of tiled bathrooms.
This one and a half-story home is nestled on a private lot.
2859 Corby Street has an unfinished basement, perfect for extra storage.
Park with confidence in your dedicated Driveway.
Click "Request a tour" to schedule your free self-tour.
In addition to the monthly rent, tenants are responsible for all utilities (gas, electric, water, and sewer), a monthly Resident Protection Plus+ ($53.68 per month), and a monthly Utility Bill Management ($14.99 per month) when utility bills are processed by American Avenue or Conservice rather than the tenant paying all utility bills directly. Other fees that may be incurred by tenants where permitted by state law may include monthly Animal Rent ($55 per pet per month), Late Fees ($95 per late payment), Notice Fees ($95 per demand letter), Returned Payment Fees ($50 per returned payment), charges for tenant-caused damage and violations, and additional charges or fees as detailed in the lease. Fees may be lower in certain states, please read your lease carefully for details.
Applications are processed in the order they are completed and received. We gladly accept Section 8 / Housing Choice Vouchers. We consider a variety of factors, including household income, estimated living expenses, and credit history in our application review process. Application does not guarantee a lease.
American Avenue is an Equal Housing Lessor under the FHA. Applicable local, state and federal laws may apply. Lease terms and conditions apply. This is not an offer to rent. You must submit additional information for review and approval. Listing features may not be accurate and should be confirmed by touring the home.
Avoid rental scams! American Avenue does not list homes on Facebook Marketplace or Craigslist. We will never ask you to pay money via Zelle, CashApp, Bitcoin, or any method outside our website. Do not trust anyone offering you this home for a lower price than you see advertised here.

Map
- 3019 Corby St
- 2907 Bristol St
- 1614 N 28th St
- 2049 Florence Blvd
- 3830 Blondo St
- 3736 Decatur St
- 3827 Parker St
- 3355 N 40th Ave
- 3019 Lincoln Blvd
- 1005 N 20th St
- 4316 Erskine St
- 4242 Pinkney St
- 2929 California Plaza
- 4514 N 36th Ave
- 602 N 33rd St
- 1607 Military Ave
- 3483 Larimore Ave
- 4018 N 42nd St
- 1015 N 16th St
- 1524 Cuming St