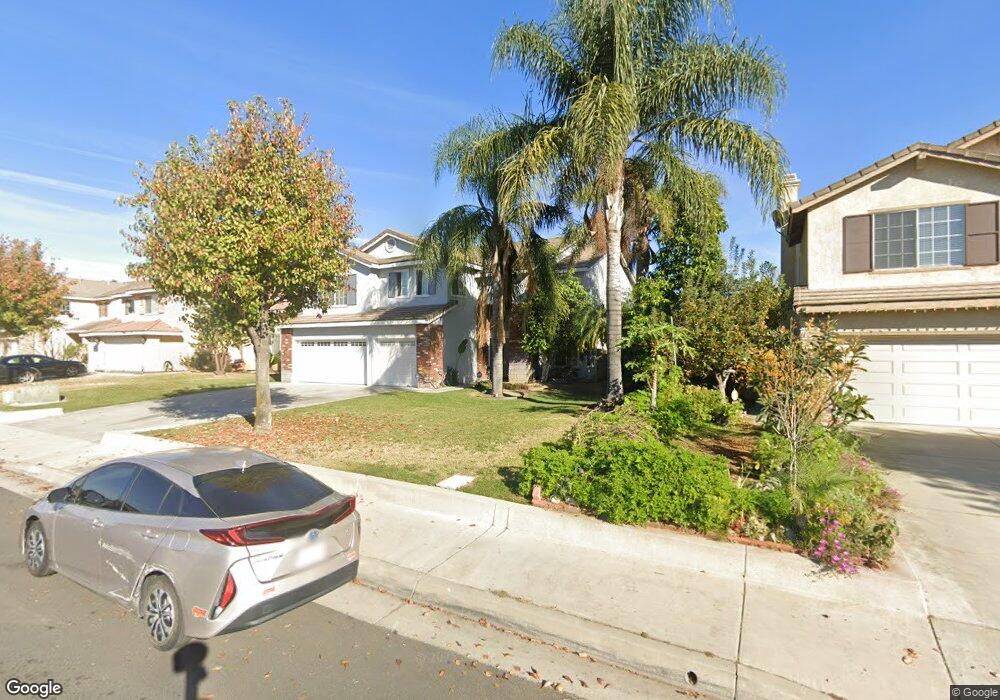
2859 S Bon View Ave Ontario, CA 91761
Ontario Ranch NeighborhoodEstimated Value: $852,000 - $1,096,000
4
Beds
3
Baths
3,064
Sq Ft
$313/Sq Ft
Est. Value
About This Home
This home is located at 2859 S Bon View Ave, Ontario, CA 91761 and is currently estimated at $958,874, approximately $312 per square foot. 2859 S Bon View Ave is a home located in San Bernardino County with nearby schools including Liberty Elementary School, Woodcrest Junior High, and Chino High School.
Ownership History
Date
Name
Owned For
Owner Type
Purchase Details
Closed on
Apr 7, 1999
Sold by
Ontario 120/Af Xiv Ltd
Bought by
Young Philip and Yang Wen Lien
Current Estimated Value
Home Financials for this Owner
Home Financials are based on the most recent Mortgage that was taken out on this home.
Original Mortgage
$110,000
Interest Rate
7.4%
Create a Home Valuation Report for This Property
The Home Valuation Report is an in-depth analysis detailing your home's value as well as a comparison with similar homes in the area
Home Values in the Area
Average Home Value in this Area
Purchase History
| Date | Buyer | Sale Price | Title Company |
|---|---|---|---|
| Young Philip | $220,000 | Fidelity National Title Co |
Source: Public Records
Mortgage History
| Date | Status | Borrower | Loan Amount |
|---|---|---|---|
| Previous Owner | Young Philip | $110,000 |
Source: Public Records
Tax History Compared to Growth
Tax History
| Year | Tax Paid | Tax Assessment Tax Assessment Total Assessment is a certain percentage of the fair market value that is determined by local assessors to be the total taxable value of land and additions on the property. | Land | Improvement |
|---|---|---|---|---|
| 2025 | $3,665 | $338,124 | $116,813 | $221,311 |
| 2024 | $3,665 | $331,495 | $114,523 | $216,972 |
| 2023 | $3,562 | $324,995 | $112,277 | $212,718 |
| 2022 | $3,537 | $318,622 | $110,075 | $208,547 |
| 2021 | $3,466 | $312,375 | $107,917 | $204,458 |
| 2020 | $3,422 | $309,172 | $106,810 | $202,362 |
| 2019 | $3,362 | $303,110 | $104,716 | $198,394 |
| 2018 | $3,286 | $297,167 | $102,663 | $194,504 |
| 2017 | $3,225 | $291,340 | $100,650 | $190,690 |
| 2016 | $3,015 | $285,627 | $98,676 | $186,951 |
| 2015 | $2,954 | $281,337 | $97,194 | $184,143 |
| 2014 | $2,895 | $275,826 | $95,290 | $180,536 |
Source: Public Records
Map
Nearby Homes
- 2919 S Caldwell Ave
- 1020 E Tam o Shanter Ct
- 2708 S Parkside Dr
- 2437 S Garfield Place
- 2408 S Taylor Place
- 2453 S Marigold Place
- 4235 S Gasly Paseo
- 0 Vineyard Unit CV25067044
- 4245 S Grasly Paseo
- 4233 S Grasly Paseo
- 0 Phillips Unit CV23180894
- 513 E Fairfield Ct
- 2300 S Sultana Ave Unit 298
- 209 W Via Rua Flores
- 2413 S Parco Ave
- 114 Cormorant Dr
- 2119 S Phoenix Place
- 2535 S Imperial Place
- 2817 S Lassen Ave
- 2890 S Via Belamaria
- 2851 S Bon View Ave
- 2867 S Bon View Ave
- 911 Doral Ct
- 2843 S Bon View Ave
- 2875 S Bon View Ave
- 912 Doral Ct
- 919 Doral Ct
- 2864 S Bon View Ave
- 2872 S Bon View Ave
- 914 E Deerfield St
- 2835 S Bon View Ave
- 2856 S Bon View Ave
- 2883 S Bon View Ave
- 2880 S Bon View Ave
- 2848 S Bon View Ave
- 920 Doral Ct
- 610 E Lena Privado
- 602 E Lena Privado
- 922 E Deerfield St
- 927 Doral Ct