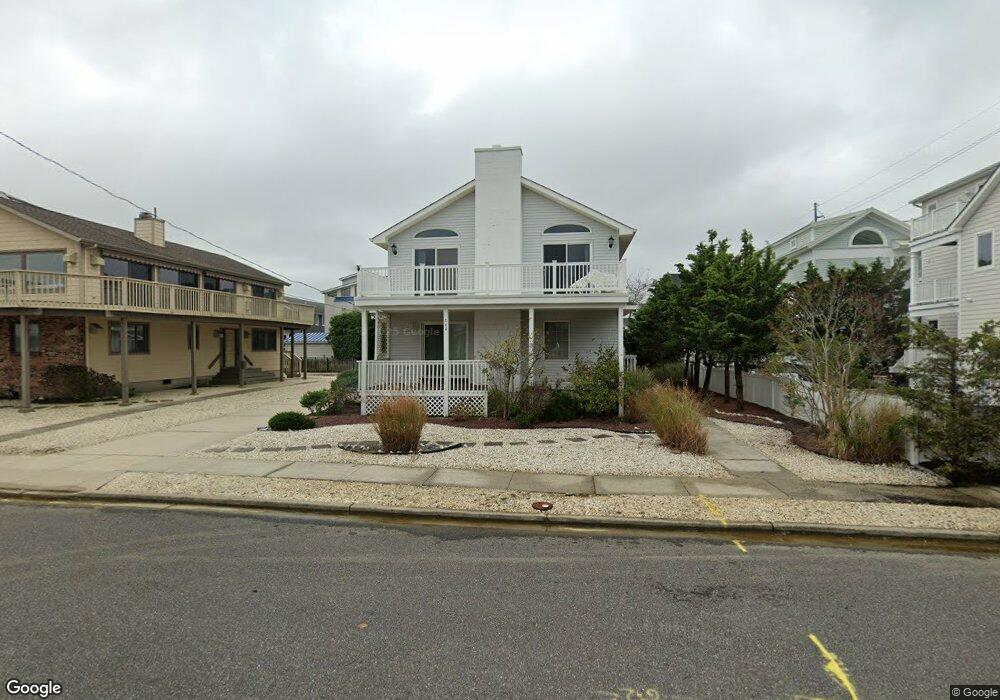
286 56th St Avalon, NJ 08202
Estimated Value: $2,633,650 - $4,020,000
--
Bed
--
Bath
2,206
Sq Ft
$1,427/Sq Ft
Est. Value
About This Home
This home is located at 286 56th St, Avalon, NJ 08202 and is currently estimated at $3,147,413, approximately $1,426 per square foot. 286 56th St is a home located in Cape May County with nearby schools including Avalon Elementary School.
Ownership History
Date
Name
Owned For
Owner Type
Purchase Details
Closed on
Sep 8, 2017
Sold by
Evangelista Simplicio and Evangelista Gail
Bought by
Simplicio E Evangelista Agreement Of Tru
Current Estimated Value
Purchase Details
Closed on
Feb 24, 1997
Sold by
Hagenman Daniel C
Bought by
Evangelista Simplicio
Home Financials for this Owner
Home Financials are based on the most recent Mortgage that was taken out on this home.
Original Mortgage
$314,000
Outstanding Balance
$38,212
Interest Rate
7.78%
Estimated Equity
$3,109,201
Create a Home Valuation Report for This Property
The Home Valuation Report is an in-depth analysis detailing your home's value as well as a comparison with similar homes in the area
Home Values in the Area
Average Home Value in this Area
Purchase History
| Date | Buyer | Sale Price | Title Company |
|---|---|---|---|
| Simplicio E Evangelista Agreement Of Tru | -- | None Available | |
| Evangelista Simplicio | $392,000 | -- |
Source: Public Records
Mortgage History
| Date | Status | Borrower | Loan Amount |
|---|---|---|---|
| Open | Evangelista Simplicio | $314,000 |
Source: Public Records
Tax History Compared to Growth
Tax History
| Year | Tax Paid | Tax Assessment Tax Assessment Total Assessment is a certain percentage of the fair market value that is determined by local assessors to be the total taxable value of land and additions on the property. | Land | Improvement |
|---|---|---|---|---|
| 2025 | $7,552 | $1,229,900 | $1,000,000 | $229,900 |
| 2024 | $7,552 | $1,229,900 | $1,000,000 | $229,900 |
| 2023 | $7,490 | $1,229,900 | $1,000,000 | $229,900 |
| 2022 | $6,986 | $1,229,900 | $1,000,000 | $229,900 |
| 2021 | $6,717 | $1,229,900 | $1,000,000 | $229,900 |
| 2020 | $6,469 | $1,229,900 | $1,000,000 | $229,900 |
| 2019 | $6,272 | $1,229,900 | $1,000,000 | $229,900 |
| 2018 | $6,002 | $1,229,900 | $1,000,000 | $229,900 |
| 2017 | $5,819 | $1,046,600 | $800,000 | $246,600 |
| 2016 | $5,756 | $1,046,600 | $800,000 | $246,600 |
| 2015 | $5,662 | $1,046,600 | $800,000 | $246,600 |
| 2014 | $5,599 | $1,046,600 | $800,000 | $246,600 |
Source: Public Records
Map
Nearby Homes
- 245 57th St
- 5765 Ocean Dr
- 5499 Dune Dr
- 6229 Dune Dr
- 150 64th St
- 4640 Ocean Dr
- 4610 4th Ave
- 6762 Ocean Dr Unit 6762
- 6772 Ocean Dr Unit 6772
- 264 41st St
- 22 Pelican Dr S
- 177 74th St
- 7463 Ocean Dr
- 74 38th St
- 253 35th St Unit WEST
- 285 78th St
- 3429 Dune Dr
- 304 78th St Unit East
- 315 79th St Unit 315
- 7888 Dune Dr Unit 218