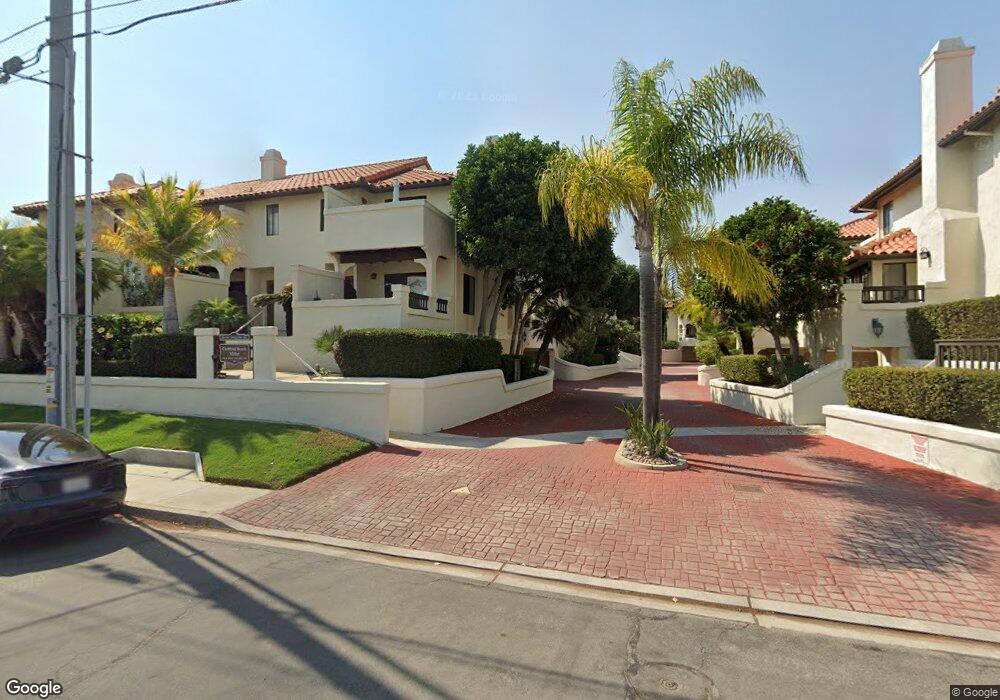
286 Chinquapin Ave Unit A Carlsbad, CA 92008
North Beach NeighborhoodEstimated Value: $1,292,000 - $1,542,000
3
Beds
3
Baths
1,629
Sq Ft
$853/Sq Ft
Est. Value
About This Home
This home is located at 286 Chinquapin Ave Unit A, Carlsbad, CA 92008 and is currently estimated at $1,389,513, approximately $852 per square foot. 286 Chinquapin Ave Unit A is a home located in San Diego County with nearby schools including Carlsbad High School, Sage Creek High, and St. Patrick Catholic School.
Ownership History
Date
Name
Owned For
Owner Type
Purchase Details
Closed on
Sep 1, 2017
Sold by
Robles Anna Marie and Trevino Richard James
Bought by
286 Chinquapin Ave Llc
Current Estimated Value
Purchase Details
Closed on
Sep 2, 2015
Sold by
Robles Anna Marie and Trevino Richard James
Bought by
Robles Anna Marie and Trevino Richard James
Purchase Details
Closed on
Mar 25, 2015
Sold by
Robles Anna Marie and Trevino Richard James
Bought by
Robles Anna Marie and Trevino Richard James
Purchase Details
Closed on
Jun 14, 1999
Sold by
Trevino Maria R Tr
Bought by
Trevino Maria R and The Maria R Trevino Qualified Personal R
Purchase Details
Closed on
Sep 27, 1989
Purchase Details
Closed on
Oct 14, 1988
Purchase Details
Closed on
Sep 23, 1985
Create a Home Valuation Report for This Property
The Home Valuation Report is an in-depth analysis detailing your home's value as well as a comparison with similar homes in the area
Home Values in the Area
Average Home Value in this Area
Purchase History
| Date | Buyer | Sale Price | Title Company |
|---|---|---|---|
| 286 Chinquapin Ave Llc | -- | None Available | |
| Robles Anna Marie | -- | None Available | |
| Robles Anna Marie | -- | None Available | |
| Robles Anna M | -- | None Available | |
| Robles Anna M | -- | None Available | |
| Trevino Maria R | -- | -- | |
| Trevino Maria R | -- | -- | |
| Trevino Maria R | -- | -- | |
| Trevino Maria R | -- | -- | |
| -- | $208,700 | -- | |
| -- | $187,900 | -- | |
| -- | $139,900 | -- |
Source: Public Records
Tax History Compared to Growth
Tax History
| Year | Tax Paid | Tax Assessment Tax Assessment Total Assessment is a certain percentage of the fair market value that is determined by local assessors to be the total taxable value of land and additions on the property. | Land | Improvement |
|---|---|---|---|---|
| 2025 | $3,967 | $377,125 | $193,162 | $183,963 |
| 2024 | $3,967 | $369,731 | $189,375 | $180,356 |
| 2023 | $3,946 | $362,482 | $185,662 | $176,820 |
| 2022 | $3,885 | $355,375 | $182,022 | $173,353 |
| 2021 | $3,856 | $348,407 | $178,453 | $169,954 |
| 2020 | $3,831 | $344,836 | $176,624 | $168,212 |
| 2019 | $3,762 | $338,075 | $173,161 | $164,914 |
| 2018 | $3,603 | $331,447 | $169,766 | $161,681 |
| 2017 | $90 | $324,949 | $166,438 | $158,511 |
| 2016 | $3,400 | $318,578 | $163,175 | $155,403 |
| 2015 | $3,387 | $313,793 | $160,724 | $153,069 |
| 2014 | -- | $307,647 | $157,576 | $150,071 |
Source: Public Records
Map
Nearby Homes
- 320 Chinquapin Ave
- 324 Chinquapin Ave
- 314 Chinquapin Ave
- 312 Chinquapin Ave
- 334 Date Ave
- 370 Tamarack Ave
- 111 Sequoia Ave Unit C
- 4007 Canario St Unit E
- 4009 Canario St Unit H
- 368 Hemlock Ave
- 385 Juniper Ave
- 160 Hemlock Ave
- 256 Juniper Ave Unit B6
- 801 Kalpati Cir Unit B
- 141 Cherry Ave
- 4020 Layang Cir Unit C
- Cherry Beach Homes Plan at Cherry Beach Homes - Cherry Beach homes
- 164 Cherry Ave
- 832 Kalpati Cir Unit E
- 817 Kalpati Cir Unit 212
- 288 Chinquapin Ave Unit ID1248661P
- 290 Chinquapin Ave Unit 4
- 286 Chinquapin Ave
- 292 Chinquapin Ave Unit B
- 292 Chinquapin Ave Unit A
- 298 Chinquapin Ave Unit B
- 298 Chinquapin Ave Unit A
- 280 Chinquapin Ave Unit A
- 280 Chinquapin Ave Unit B
- 280 Chinquapin Ave Unit C
- 282 Chinquapin Ave Unit A
- 282 Chinquapin Ave Unit B
- 282 Chinquapin Ave Unit C
- 286 Chinquapin Ave Unit B
- 286 Chinquapin Ave Unit C
- 288 Chinquapin Ave Unit A
- 288 Chinquapin Ave Unit B
- 288 Chinquapin Ave Unit C
- 290 Chinquapin Ave Unit A
- 290 Chinquapin Ave Unit C