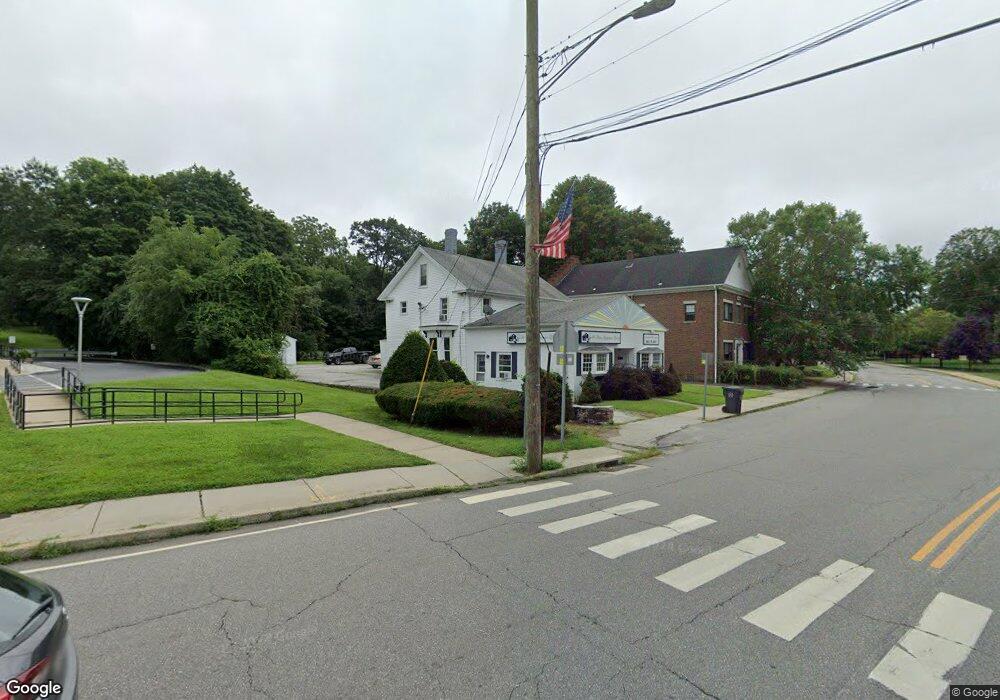
286 Main St Danielson, CT 06239
Studio
--
Bath
5,950
Sq Ft
13,504
Sq Ft
About This Home
This home is located at 286 Main St, Danielson, CT 06239. 286 Main St is a home located in Windham County with nearby schools including Killingly Central School, Killingly Memorial School, and Killingly Intermediate School.
Ownership History
Date
Name
Owned For
Owner Type
Purchase Details
Closed on
May 30, 2025
Sold by
Willington Hill Llc
Bought by
Summertime Properties Llc
Purchase Details
Closed on
Jun 14, 2013
Sold by
Toutant Roland J
Bought by
Willington Hill Llc
Home Financials for this Owner
Home Financials are based on the most recent Mortgage that was taken out on this home.
Original Mortgage
$100,000
Interest Rate
3.39%
Mortgage Type
Commercial
Purchase Details
Closed on
May 29, 2013
Sold by
K Of C Llc and Young
Bought by
Toutant Roland J
Home Financials for this Owner
Home Financials are based on the most recent Mortgage that was taken out on this home.
Original Mortgage
$100,000
Interest Rate
3.39%
Mortgage Type
Commercial
Purchase Details
Closed on
Mar 19, 2001
Sold by
Saint James Kofc
Bought by
Phaiah Mitchell D
Create a Home Valuation Report for This Property
The Home Valuation Report is an in-depth analysis detailing your home's value as well as a comparison with similar homes in the area
Home Values in the Area
Average Home Value in this Area
Purchase History
| Date | Buyer | Sale Price | Title Company |
|---|---|---|---|
| Summertime Properties Llc | -- | None Available | |
| Summertime Properties Llc | -- | None Available | |
| Willington Hill Llc | $150,000 | -- | |
| Willington Hill Llc | $150,000 | -- | |
| Toutant Roland J | $145,000 | -- | |
| Toutant Roland J | $145,000 | -- | |
| Phaiah Mitchell D | $77,500 | -- | |
| Phaiah Mitchell D | $77,500 | -- |
Source: Public Records
Mortgage History
| Date | Status | Borrower | Loan Amount |
|---|---|---|---|
| Previous Owner | Phaiah Mitchell D | $100,000 | |
| Previous Owner | Phaiah Mitchell D | $100,000 |
Source: Public Records
Tax History
| Year | Tax Paid | Tax Assessment Tax Assessment Total Assessment is a certain percentage of the fair market value that is determined by local assessors to be the total taxable value of land and additions on the property. | Land | Improvement |
|---|---|---|---|---|
| 2025 | $6,104 | $243,660 | $44,360 | $199,300 |
| 2024 | $5,826 | $243,660 | $44,360 | $199,300 |
| 2023 | $7,179 | $223,720 | $36,680 | $187,040 |
| 2022 | $6,754 | $223,720 | $36,680 | $187,040 |
| 2021 | $6,754 | $223,720 | $36,680 | $187,040 |
| 2020 | $6,642 | $223,720 | $36,680 | $187,040 |
| 2019 | $6,714 | $223,720 | $36,680 | $187,040 |
| 2017 | $7,075 | $219,310 | $36,680 | $182,630 |
| 2016 | $7,075 | $219,310 | $36,680 | $182,630 |
| 2015 | $6,932 | $219,310 | $36,680 | $182,630 |
| 2014 | $6,768 | $219,310 | $36,680 | $182,630 |
Source: Public Records
Map
Nearby Homes
Your Personal Tour Guide
Ask me questions while you tour the home.