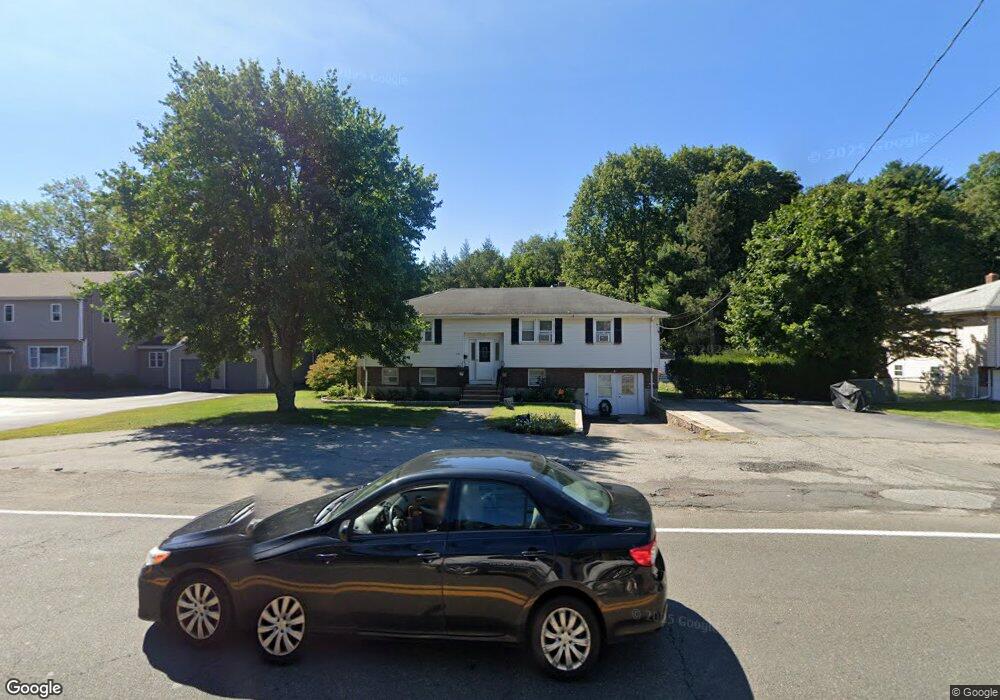
286 Main St Saugus, MA 01906
Oakland Vale NeighborhoodEstimated Value: $744,000 - $859,000
4
Beds
3
Baths
1,267
Sq Ft
$626/Sq Ft
Est. Value
About This Home
This home is located at 286 Main St, Saugus, MA 01906 and is currently estimated at $793,309, approximately $626 per square foot. 286 Main St is a home located in Essex County with nearby schools including Saugus High School, Pioneer Charter School Of Science II, and Melrose Montessori School.
Ownership History
Date
Name
Owned For
Owner Type
Purchase Details
Closed on
Jan 20, 2021
Sold by
Ring Darren S and Ring Michelle M
Bought by
Ring Michelle M
Current Estimated Value
Home Financials for this Owner
Home Financials are based on the most recent Mortgage that was taken out on this home.
Original Mortgage
$389,675
Outstanding Balance
$347,110
Interest Rate
2.6%
Mortgage Type
FHA
Estimated Equity
$446,199
Purchase Details
Closed on
Dec 5, 2006
Sold by
Bostrom Rita Ann and Famolare Rita-Ann
Bought by
Ring Darren S and Ring Michelle M
Home Financials for this Owner
Home Financials are based on the most recent Mortgage that was taken out on this home.
Original Mortgage
$389,672
Interest Rate
6.24%
Create a Home Valuation Report for This Property
The Home Valuation Report is an in-depth analysis detailing your home's value as well as a comparison with similar homes in the area
Home Values in the Area
Average Home Value in this Area
Purchase History
| Date | Buyer | Sale Price | Title Company |
|---|---|---|---|
| Ring Michelle M | -- | None Available | |
| Ring Darren S | $470,000 | -- |
Source: Public Records
Mortgage History
| Date | Status | Borrower | Loan Amount |
|---|---|---|---|
| Open | Ring Michelle M | $389,675 | |
| Previous Owner | Ring Darren S | $389,672 | |
| Previous Owner | Ring Darren S | $352,500 |
Source: Public Records
Tax History Compared to Growth
Tax History
| Year | Tax Paid | Tax Assessment Tax Assessment Total Assessment is a certain percentage of the fair market value that is determined by local assessors to be the total taxable value of land and additions on the property. | Land | Improvement |
|---|---|---|---|---|
| 2025 | $6,624 | $620,200 | $331,600 | $288,600 |
| 2024 | $6,215 | $583,600 | $301,500 | $282,100 |
| 2023 | $5,999 | $532,800 | $271,500 | $261,300 |
| 2022 | $5,821 | $484,700 | $248,400 | $236,300 |
| 2021 | $5,586 | $452,700 | $216,400 | $236,300 |
| 2020 | $5,238 | $439,400 | $206,400 | $233,000 |
| 2019 | $4,967 | $407,800 | $186,400 | $221,400 |
| 2018 | $4,568 | $394,500 | $181,400 | $213,100 |
| 2017 | $4,366 | $362,300 | $169,400 | $192,900 |
| 2016 | $4,236 | $347,200 | $161,000 | $186,200 |
| 2015 | $3,977 | $330,900 | $153,400 | $177,500 |
| 2014 | $3,787 | $326,200 | $153,400 | $172,800 |
Source: Public Records
Map
Nearby Homes
- 805 Lewis o Gray Dr
- 906 Lewis o Gray Dr
- 21 Athens Dr
- 148 Forest St
- 846 Broadway Unit 40
- 10 Heritage Ln
- 9 Thomas St Unit 11
- 409 Lynn Fells Pkwy
- 515 Upham St
- 7 Nirvana Dr
- 340 Essex St
- 225 Howard St
- 57 Vine St
- 15 Shore Rd
- 38 Vine St
- 12B Cheever Ave
- 12C Cheever Ave
- 905 Sherwood Forest Ln
- 29 Susan Dr
- 10 Summer St