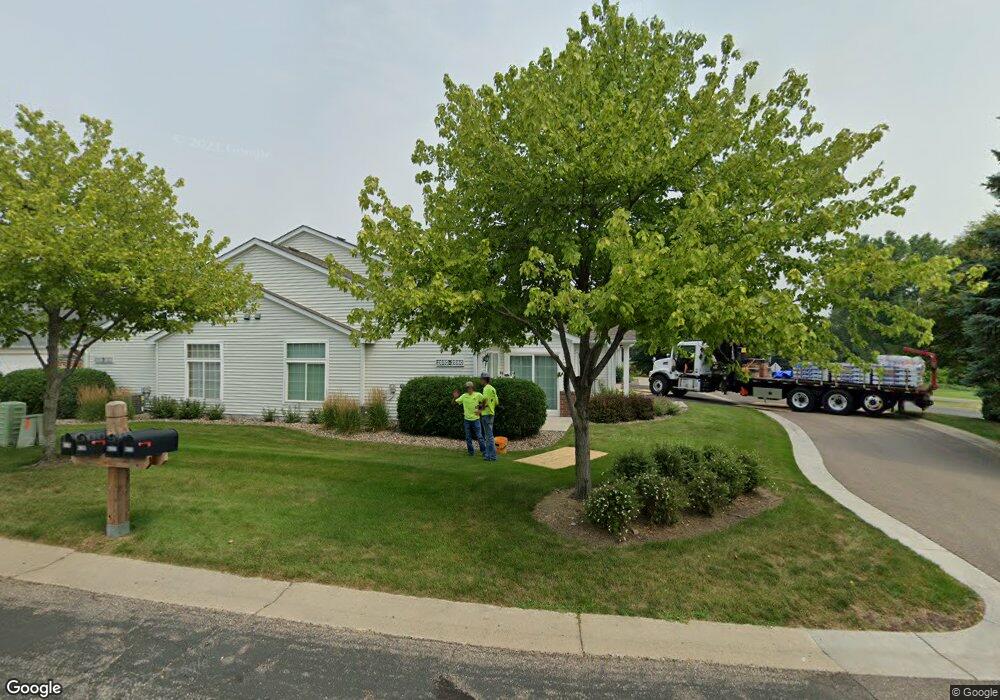
2860 87th St E Unit 2 Inver Grove Heights, MN 55076
Estimated Value: $281,000 - $291,000
2
Beds
2
Baths
1,280
Sq Ft
$224/Sq Ft
Est. Value
About This Home
This home is located at 2860 87th St E Unit 2, Inver Grove Heights, MN 55076 and is currently estimated at $287,004, approximately $224 per square foot. 2860 87th St E Unit 2 is a home located in Dakota County with nearby schools including Pine Bend Elementary School, Inver Grove Heights Middle School, and Simley Senior High School.
Ownership History
Date
Name
Owned For
Owner Type
Purchase Details
Closed on
Feb 24, 2021
Sold by
Quam Gary W and Quam Twila A
Bought by
Brust Pamela K
Current Estimated Value
Home Financials for this Owner
Home Financials are based on the most recent Mortgage that was taken out on this home.
Original Mortgage
$113,000
Outstanding Balance
$101,296
Interest Rate
2.7%
Mortgage Type
New Conventional
Estimated Equity
$185,708
Purchase Details
Closed on
Nov 21, 2019
Sold by
Wilmes Billy H and Wilmes Joyce L
Bought by
Quam Gary W and Quam Twila A
Home Financials for this Owner
Home Financials are based on the most recent Mortgage that was taken out on this home.
Original Mortgage
$220,200
Interest Rate
3%
Mortgage Type
New Conventional
Purchase Details
Closed on
May 30, 1997
Sold by
Carlson Verneel E
Bought by
Wilmes Violet E
Purchase Details
Closed on
Sep 18, 1995
Sold by
Rottlund Company
Bought by
Carlson Verniel E
Create a Home Valuation Report for This Property
The Home Valuation Report is an in-depth analysis detailing your home's value as well as a comparison with similar homes in the area
Home Values in the Area
Average Home Value in this Area
Purchase History
| Date | Buyer | Sale Price | Title Company |
|---|---|---|---|
| Brust Pamela K | $298,000 | Watermark Title Agency | |
| Quam Gary W | $244,752 | Results Title | |
| Wilmes Violet E | $119,900 | -- | |
| Carlson Verniel E | $115,200 | -- | |
| Brust Pamela Pamela | $298,000 | -- |
Source: Public Records
Mortgage History
| Date | Status | Borrower | Loan Amount |
|---|---|---|---|
| Open | Brust Pamela K | $113,000 | |
| Previous Owner | Quam Gary W | $220,200 | |
| Closed | Brust Pamela Pamela | $113,000 |
Source: Public Records
Tax History Compared to Growth
Tax History
| Year | Tax Paid | Tax Assessment Tax Assessment Total Assessment is a certain percentage of the fair market value that is determined by local assessors to be the total taxable value of land and additions on the property. | Land | Improvement |
|---|---|---|---|---|
| 2024 | $2,690 | $271,700 | $44,500 | $227,200 |
| 2023 | $2,690 | $271,700 | $44,800 | $226,900 |
| 2022 | $2,536 | $269,700 | $44,700 | $225,000 |
| 2021 | $2,434 | $241,200 | $38,900 | $202,300 |
| 2020 | $2,270 | $229,100 | $37,100 | $192,000 |
| 2019 | $2,472 | $215,200 | $35,300 | $179,900 |
| 2018 | $2,239 | $201,700 | $32,700 | $169,000 |
| 2017 | $2,156 | $181,400 | $30,200 | $151,200 |
| 2016 | $2,168 | $170,000 | $28,800 | $141,200 |
| 2015 | $2,218 | $169,500 | $27,400 | $142,100 |
| 2014 | -- | $162,800 | $25,200 | $137,600 |
| 2013 | -- | $144,100 | $23,300 | $120,800 |
Source: Public Records
Map
Nearby Homes
- 2853 87th St E Unit 29
- 8789 Branson Dr Unit 72
- 8816 Brunell Way Unit 404
- 8904 Brunswick Path Unit 2104
- 8755 Benson Way Unit 101
- 8827 Coffman Path
- 8124 Clifford Cir
- 8916 Coffman Path
- TBd Cahill Blvd Blvd
- 3295 80th St E Unit 508
- 8336 Cloman Ave
- 7924 Barbara Ave
- 7910 Banks Path
- 7636 Borman Way
- 7944 Charles Way
- 8404 Copperfield Way Unit 101
- 8406 Copperfield Way Unit 102
- 3085 Upper 76th St E
- 2584 76th St E
- 9649-9665 Cedarwood Ct
- 2726 87th St E
- 2734 87th St E
- 2772 87th St E
- 2790 87th St E
- 2804 87th St E
- 2810 87th St E Unit 8
- 2818 87th St E
- 2832 87th St E Unit 6
- 2824 87th St E
- 2838 87th St E
- 2846 87th St E
- 2852 87th St E
- 2804 87th St E Unit 10
- 2838 87th St E Unit 4
- 2852 87th St E Unit 1
- 2790 87th St E Unit 11
- 2734 2734 87th-Street-e
- 2796 87th St E
- 2782 87th St E
- 2776 87th St E Unit 14