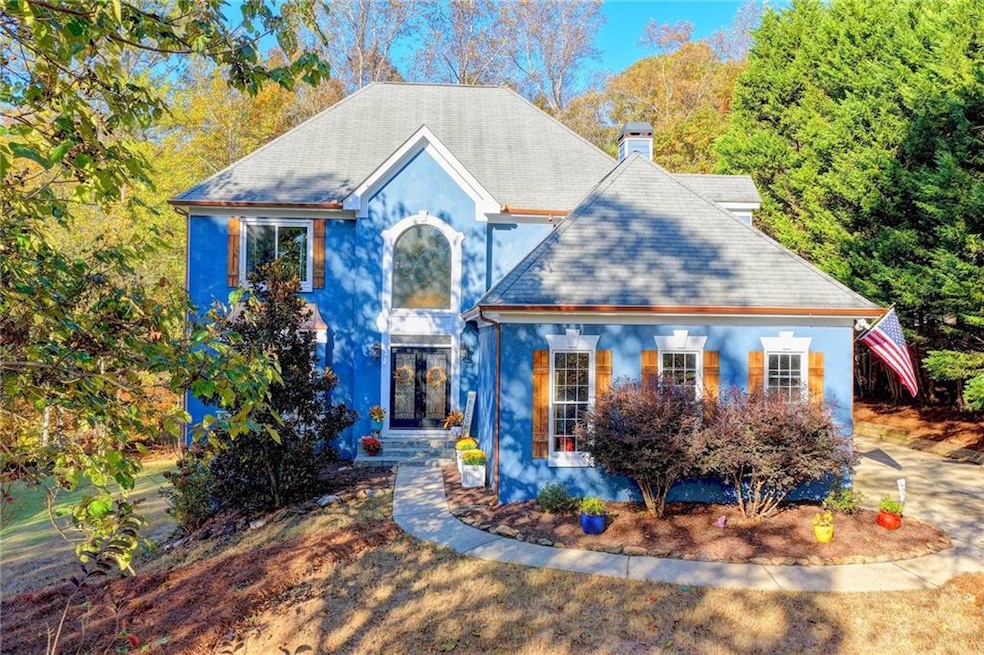
2860 Chamonix Dr Cumming, GA 30041
Estimated payment $3,061/month
Highlights
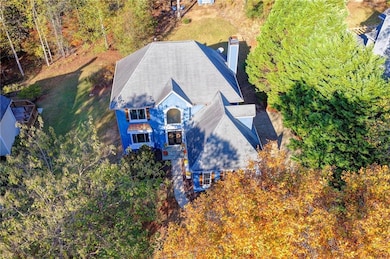
- View of Trees or Woods
- Deck
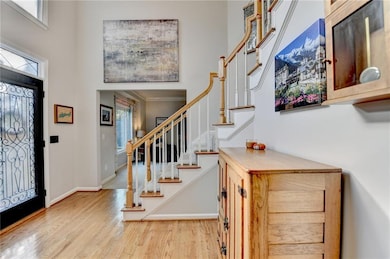
- Vaulted Ceiling
- Haw Creek Elementary School Rated A
- Creek On Lot
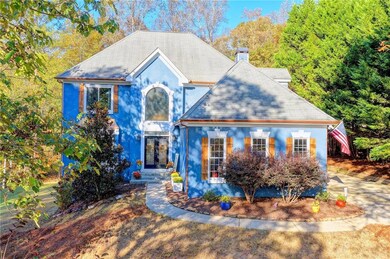
- Traditional Architecture
About This Home
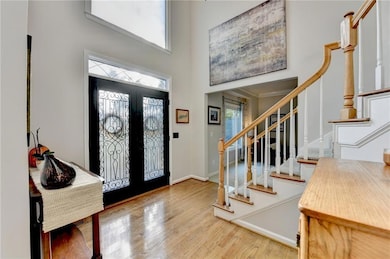
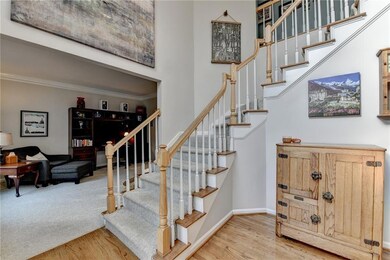
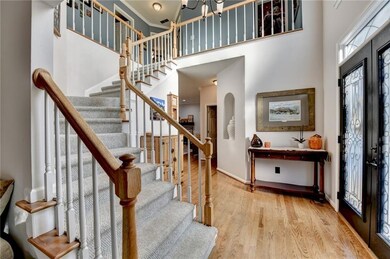
BRAND NEW ROOF IN PROGRESS!)Award Winning South Forsyth County Schools!!! Step into your future haven within a peaceful, highly desirable neighborhood, nestled on a secluded .6-acre lot that offers both privacy and charm. Enter through stunning double leaded glass doors into a grand two-story foyer, and admire the elegant crown molding in the formal living and dining rooms. The newly renovated kitchen is a chef’s dream, showcasing gleaming hardwood floors, bespoke cabinetry, luxurious stone countertops, a stylish tile backsplash, modern appliances, and a delightful breakfast bar where mornings begin with ease. Relax in the airy vaulted keeping room or gather with loved ones in the welcoming family room, highlighted by a cozy brick fireplace. The spacious laundry room and custom powder room add convenience and flair. Retreat to your tranquil primary suite, featuring exquisite triple trey ceilings, generous his-and-her closets, and a spa-inspired bath complete with a soaking tub, frameless glass shower, Silestone vanity, radiant lighted mirrors, and contemporary fixtures. The additional bedrooms provide comfort and updated style, while the oversized bonus room offers endless possibilities—as a fourth bedroom, a private office, or a home theater. Step outside to enjoy the expansive deck overlooking a level backyard perfect for gatherings around the fire pit, plus a handy utility building for all your storage needs. The partially finished basement boasts designated spaces for workouts and DIY projects. Don’t let this extraordinary opportunity slip away—envision yourself relaxing, entertaining, and creating memories in this remarkable home. Schedule your visit today!
Home Details
Home Type
- Single Family
Est. Annual Taxes
- $4,716
Year Built
- Built in 1991
Lot Details
- 0.6 Acre Lot
- Private Yard
- Garden
- Back Yard
HOA Fees
- $38 Monthly HOA Fees
Parking
- 2 Car Garage
- Parking Accessed On Kitchen Level
Home Design
- Traditional Architecture
- Block Foundation
- Composition Roof
- Concrete Siding
Interior Spaces
- 2-Story Property
- Crown Molding
- Tray Ceiling
- Vaulted Ceiling
- Ceiling Fan
- Recessed Lighting
- Brick Fireplace
- Double Pane Windows
- Two Story Entrance Foyer
- Living Room
- Formal Dining Room
- Workshop
- Views of Woods
- Finished Basement
- Partial Basement
- Pull Down Stairs to Attic
- Fire and Smoke Detector
Kitchen
- Eat-In Kitchen
- Breakfast Bar
- Microwave
- Dishwasher
- Kitchen Island
- Disposal
Flooring
- Wood
- Carpet
Bedrooms and Bathrooms
- Dual Closets
- Walk-In Closet
- Dual Vanity Sinks in Primary Bathroom
- Separate Shower in Primary Bathroom
- Soaking Tub
Laundry
- Laundry in Mud Room
- Laundry Room
- Laundry on main level
- Dryer
- Washer
- Sink Near Laundry
Outdoor Features
- Creek On Lot
- Deck
- Front Porch
Schools
- Haw Creek Elementary School
- Lakeside - Forsyth Middle School
- South Forsyth High School
Utilities
- Forced Air Heating System
- Heating System Uses Natural Gas
- Septic Tank
- High Speed Internet
- Phone Available
- Satellite Dish
- Cable TV Available
Listing and Financial Details
- Assessor Parcel Number 202 145
Community Details
Overview
- $455 Initiation Fee
- Geneva Woods HOA
- Geneva Woods Subdivision
- Rental Restrictions
Recreation
- Community Pool
Security
- Security Service
Map
Home Values in the Area
Average Home Value in this Area
Tax History
| Year | Tax Paid | Tax Assessment Tax Assessment Total Assessment is a certain percentage of the fair market value that is determined by local assessors to be the total taxable value of land and additions on the property. | Land | Improvement |
|---|---|---|---|---|
| 2025 | $4,716 | $209,500 | $72,000 | $137,500 |
| 2024 | $4,716 | $192,336 | $60,000 | $132,336 |
| 2023 | $4,064 | $165,112 | $40,000 | $125,112 |
| 2022 | $3,752 | $119,688 | $20,000 | $99,688 |
| 2021 | $3,305 | $119,688 | $20,000 | $99,688 |
| 2020 | $3,112 | $112,704 | $20,000 | $92,704 |
| 2019 | $3,037 | $109,824 | $20,000 | $89,824 |
| 2018 | $3,342 | $120,860 | $20,000 | $100,860 |
| 2017 | $2,907 | $104,736 | $20,000 | $84,736 |
| 2016 | $2,907 | $104,736 | $20,000 | $84,736 |
| 2015 | $2,511 | $90,296 | $16,000 | $74,296 |
| 2014 | $2,223 | $83,976 | $16,000 | $67,976 |
Property History
| Date | Event | Price | List to Sale | Price per Sq Ft |
|---|---|---|---|---|
| 12/02/2025 12/02/25 | For Sale | $499,950 | -- | $238 / Sq Ft |
Purchase History
| Date | Type | Sale Price | Title Company |
|---|---|---|---|
| Warranty Deed | $235,000 | -- | |
| Warranty Deed | -- | -- | |
| Deed | $225,000 | -- |
Mortgage History
| Date | Status | Loan Amount | Loan Type |
|---|---|---|---|
| Open | $230,743 | FHA | |
| Previous Owner | $214,670 | New Conventional | |
| Previous Owner | $180,000 | New Conventional |
Source: First Multiple Listing Service (FMLS)
MLS Number: 7674531
APN: 202-145
![]() Listings identified with the FMLS IDX logo come from FMLS and are held by brokerage firms other than the owner of this website. The listing brokerage is identified in any listing details. Information is deemed reliable but is not guaranteed. If you believe any FMLS listing contains material that infringes your copyrighted work please visit www.fmls.com/dmca to review our DMCA policy and learn how to submit a takedown request. © 2025 First Multiple Listing Service, Inc.
Listings identified with the FMLS IDX logo come from FMLS and are held by brokerage firms other than the owner of this website. The listing brokerage is identified in any listing details. Information is deemed reliable but is not guaranteed. If you believe any FMLS listing contains material that infringes your copyrighted work please visit www.fmls.com/dmca to review our DMCA policy and learn how to submit a takedown request. © 2025 First Multiple Listing Service, Inc.
Disclaimer: Certain information contained herein is derived from information provided by parties other than Homes.com. All information provided is deemed reliable, but is not guaranteed to be accurate and should be independently verified.
- 3055 Saint Gallen Ct
- 1458 Edenfield Pte
- 1458 Edenfield Pointe
- 2540 Marsha Cir
- 3000 Chamonix Dr
- 3500 Alexander Cir
- 2470 Cambridge Hills Rd
- 1415 Elgin Way
- 3340 Silver Lake Dr
- 3030 Blackstock Dr
- 2510 Benefield Rd
- 2640 Blackstock Dr
- 2335 Blackstock Dr
- 1041 Windermere Crossing
- 5613 Lancashire Ln
- 1037 Windermere Crossing
- 2115 Vistoria Dr
- 2530 Vistoria Dr
- 3245 Sparling St
- 3780 Stanford Dr
- 2470 Cambridge Hills Rd
- 2080 One White Oak Ln
- 2460 Vistoria Dr
- 2080 One White Oak Ln Unit 5106
- 2080 One White Oak Ln Unit 3309
- 2080 One White Oak Ln Unit 5407
- 3100 Preston Pointe Way
- 1600 Ronald Reagan Blvd Unit 1-5111
- 1600 Ronald Reagan Blvd Unit 1-2212
- 3765 Sweeting St Unit Basement Apartment
- 2945 Links View Way
- 1265 Wondering Way
- 1040 Rockbass Rd
- 7030 Bennington Ln
- 1015 Pebble Creek Trail
- 4645 Cold Spring Ct
- 1455 Courtney Ln
- 4315 Wykeshire Ct
- 630 Rockbass Rd
- 4595 Essen Ln
