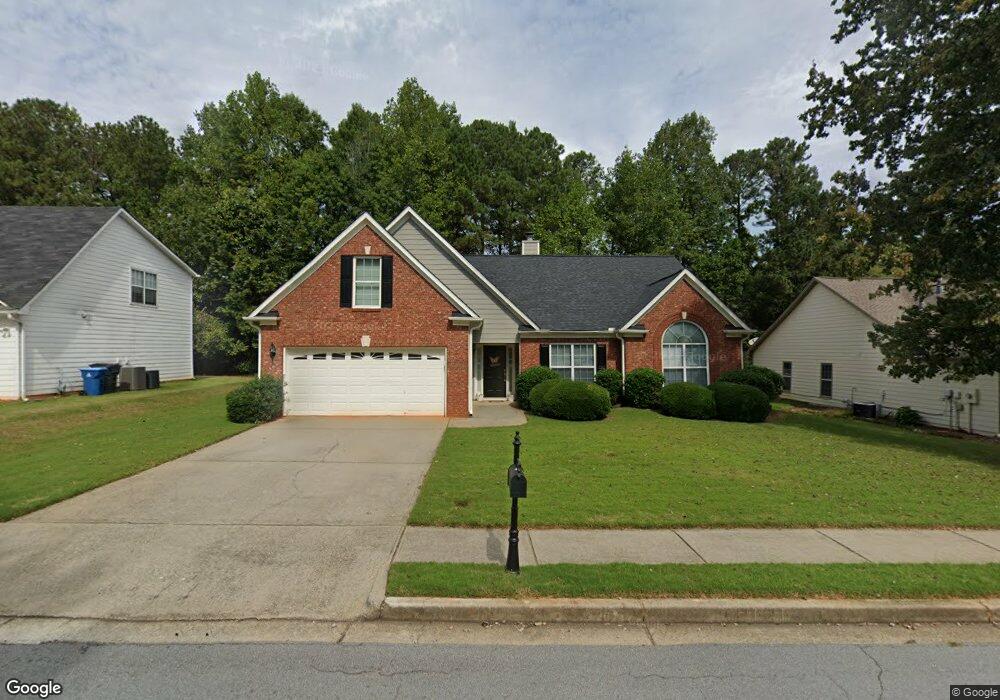
2860 Wadley Ln Dacula, GA 30019
Estimated Value: $348,246 - $379,000
3
Beds
2
Baths
2,146
Sq Ft
$171/Sq Ft
Est. Value
About This Home
This home is located at 2860 Wadley Ln, Dacula, GA 30019 and is currently estimated at $366,062, approximately $170 per square foot. 2860 Wadley Ln is a home located in Gwinnett County with nearby schools including Mulberry Elementary School, Dacula Middle School, and Dacula High School.
Ownership History
Date
Name
Owned For
Owner Type
Purchase Details
Closed on
Aug 26, 2011
Sold by
Bisanz Keith A
Bought by
Rawlings George L
Current Estimated Value
Home Financials for this Owner
Home Financials are based on the most recent Mortgage that was taken out on this home.
Original Mortgage
$79,844
Outstanding Balance
$55,034
Interest Rate
4.55%
Mortgage Type
New Conventional
Estimated Equity
$311,028
Purchase Details
Closed on
Jun 14, 2006
Sold by
Jayne Jeffrey and Jayne Sharon A
Bought by
Bisanz Keith A and Cox Barbara
Home Financials for this Owner
Home Financials are based on the most recent Mortgage that was taken out on this home.
Original Mortgage
$165,500
Interest Rate
6.49%
Mortgage Type
New Conventional
Purchase Details
Closed on
Aug 22, 2002
Sold by
Atlanco Builders Llc
Bought by
Jayne Jeffrey and Jayne Sharon A
Home Financials for this Owner
Home Financials are based on the most recent Mortgage that was taken out on this home.
Original Mortgage
$134,010
Interest Rate
6.49%
Mortgage Type
New Conventional
Create a Home Valuation Report for This Property
The Home Valuation Report is an in-depth analysis detailing your home's value as well as a comparison with similar homes in the area
Home Values in the Area
Average Home Value in this Area
Purchase History
| Date | Buyer | Sale Price | Title Company |
|---|---|---|---|
| Rawlings George L | $99,807 | -- | |
| Bisanz Keith A | $165,500 | -- | |
| Jayne Jeffrey | $148,900 | -- |
Source: Public Records
Mortgage History
| Date | Status | Borrower | Loan Amount |
|---|---|---|---|
| Open | Rawlings George L | $79,844 | |
| Previous Owner | Bisanz Keith A | $165,500 | |
| Previous Owner | Jayne Jeffrey | $134,010 |
Source: Public Records
Tax History
| Year | Tax Paid | Tax Assessment Tax Assessment Total Assessment is a certain percentage of the fair market value that is determined by local assessors to be the total taxable value of land and additions on the property. | Land | Improvement |
|---|---|---|---|---|
| 2025 | $5,642 | $151,200 | $26,120 | $125,080 |
| 2024 | $5,714 | $150,040 | $30,400 | $119,640 |
| 2023 | $5,714 | $150,040 | $30,400 | $119,640 |
| 2022 | $4,882 | $127,480 | $23,200 | $104,280 |
| 2021 | $3,708 | $93,080 | $17,200 | $75,880 |
| 2020 | $3,728 | $93,080 | $17,200 | $75,880 |
| 2019 | $3,234 | $82,840 | $17,200 | $65,640 |
| 2018 | $3,089 | $78,680 | $15,200 | $63,480 |
| 2016 | $2,640 | $65,360 | $12,000 | $53,360 |
| 2015 | $2,294 | $54,840 | $10,400 | $44,440 |
| 2014 | -- | $54,840 | $10,400 | $44,440 |
Source: Public Records
Map
Nearby Homes
- 2820 Wadley Ln
- 920 Charles Hall Dr
- 1040 Auburn Rd
- 718 Bartow Dr
- 3067 Hudson Glen Way
- 915 Harbins View Dr
- 3070 Hudson Glen Way
- 909 Pathview Ct
- 2905 The Terraces Way
- 946 Chippewa Oak Dr NE
- 1693 Caldwell Bend Ln
- 1663 Caldwell Bend Ln
- 1673 Caldwell Bend Ln
- 1683 Caldwell Bend Ln
- 1090 River Valley Dr
- 1623 Caldwell Bend Ln
- 1653 Caldwell Bend Ln
- 872 Pathview Ct
- 2954 Jasmine Brook Ct
- 2870 Wadley Ln
- 2850 Wadley Ln
- 2880 Wadley Ln
- 2840 Wadley Ln
- 2865 Wadley Ln Unit 21
- 2865 Wadley Ln
- 2855 Wadley Ln
- 2890 Wadley Ln
- 2830 Wadley Ln
- 2885 Wadley Ln
- 812 Madison Cove Way
- 2805 Wadley Ln
- 2805 Wadley Ln
- 2805 Wadley Ln
- 813 Madison Cove Way
- 813 Madison Cove Way Unit 25
- 2900 Wadley Ln
- 2810 Wadley Ln
- 802 Madison Cove Way
- 2795 Wadley Ln
Your Personal Tour Guide
Ask me questions while you tour the home.