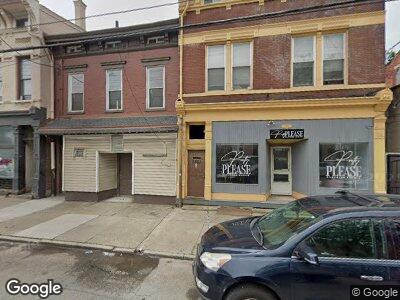
2861 Colerain Ave Cincinnati, OH 45225
Camp Washington NeighborhoodEstimated Value: $20,290
--
Bed
--
Bath
4,376
Sq Ft
$5/Sq Ft
Est. Value
About This Home
This home is located at 2861 Colerain Ave, Cincinnati, OH 45225 and is currently estimated at $20,290, approximately $4 per square foot. 2861 Colerain Ave is a home located in Hamilton County with nearby schools including Ethel M. Taylor Academy, Robert A. Taft Information Technology High School, and Gilbert A. Dater High School.
Ownership History
Date
Name
Owned For
Owner Type
Purchase Details
Closed on
Apr 15, 2019
Sold by
County Of Hamilton
Bought by
Harris Mark and Buckley Carmel
Current Estimated Value
Purchase Details
Closed on
Oct 10, 2008
Sold by
The Bank Of New York
Bought by
Pollard Henry and Pollard Angela
Purchase Details
Closed on
Jun 19, 2008
Sold by
Strong Robert E and Pakjaem Strong Nongyaw
Bought by
The Bank Of New York
Purchase Details
Closed on
Jun 7, 2002
Sold by
Robert Strong
Bought by
Strong Robert E and Pakjaem Strong Nongyaw
Home Financials for this Owner
Home Financials are based on the most recent Mortgage that was taken out on this home.
Original Mortgage
$40,000
Interest Rate
6.93%
Mortgage Type
Commercial
Purchase Details
Closed on
Sep 10, 1999
Sold by
Karl Seitz and Karl Wilma E
Bought by
Strong Robert
Create a Home Valuation Report for This Property
The Home Valuation Report is an in-depth analysis detailing your home's value as well as a comparison with similar homes in the area
Home Values in the Area
Average Home Value in this Area
Purchase History
| Date | Buyer | Sale Price | Title Company |
|---|---|---|---|
| Harris Mark | $12,000 | None Available | |
| Pollard Henry | $8,000 | Attorney | |
| The Bank Of New York | $30,000 | None Available | |
| Strong Robert E | -- | American Security Title Co | |
| Strong Robert | $23,000 | -- |
Source: Public Records
Mortgage History
| Date | Status | Borrower | Loan Amount |
|---|---|---|---|
| Previous Owner | Strong Robert E | $87,000 | |
| Previous Owner | Strong Robert E | $40,000 | |
| Previous Owner | Strong Robert | $38,500 |
Source: Public Records
Tax History Compared to Growth
Tax History
| Year | Tax Paid | Tax Assessment Tax Assessment Total Assessment is a certain percentage of the fair market value that is determined by local assessors to be the total taxable value of land and additions on the property. | Land | Improvement |
|---|---|---|---|---|
| 2024 | $434 | $5,086 | $3,136 | $1,950 |
| 2023 | $433 | $5,086 | $3,136 | $1,950 |
| 2022 | $428 | $4,561 | $2,982 | $1,579 |
| 2021 | $451 | $4,561 | $2,982 | $1,579 |
| 2020 | $452 | $4,561 | $2,982 | $1,579 |
| 2019 | $722 | $4,302 | $2,814 | $1,488 |
| 2018 | $458 | $4,302 | $2,814 | $1,488 |
| 2017 | $1,576 | $4,302 | $2,814 | $1,488 |
| 2016 | $316 | $2,870 | $1,631 | $1,239 |
| 2015 | $295 | $2,870 | $1,631 | $1,239 |
| 2014 | $296 | $2,870 | $1,631 | $1,239 |
| 2013 | $301 | $2,927 | $1,663 | $1,264 |
Source: Public Records
Map
Nearby Homes
- 2934 Sidney Ave
- 2962 Henshaw Ave
- 2946 W McMicken Ave
- 2966 W McMicken Ave
- 3068 Henshaw Ave
- 725 Riddle Rd
- 2524 Beekman St
- 3081 Henshaw Ave
- 2964 Deckebach Ave
- 2843 Marshall Ave
- 1317 Bates Ave
- 2521 Addison St
- 2861 Marshall Ave
- 2572 Liddell St
- 521 Tafel St
- 638 Probasco St
- 2571 Liddell St
- 660 Straight St
- 611 Tafel St
- 2467 W McMicken Ave
- 2861 Colerain Ave
- 2863 Colerain Ave
- 2859 Colerain Ave
- 2865 Colerain Ave
- 2855 Colerain Ave
- 2853 Colerain Ave
- 2869 Colerain Ave
- 1311 Township St
- 2868 Colerain Ave
- 2838 Spring Grove Ave
- 2900 Colerain Ave
- 2867 Henshaw Ave
- 2907 Colerain Ave
- 2855 Henshaw Ave
- 2908 Colerain Ave
- 1062 Township St
- 1060 Township St
- 2914 Colerain Ave
- 2911 Henshaw Ave
- 2838 Colerain Ave