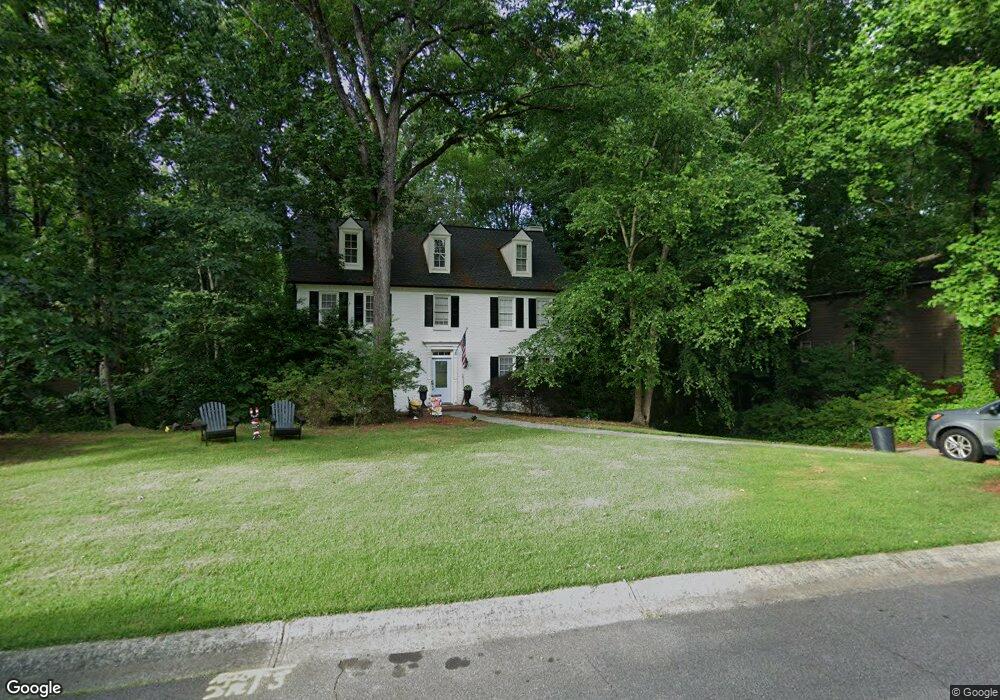
2861 Landing Dr Unit 6 Marietta, GA 30066
Sandy Plains NeighborhoodEstimated Value: $590,000 - $715,000
4
Beds
3
Baths
2,240
Sq Ft
$283/Sq Ft
Est. Value
About This Home
This home is located at 2861 Landing Dr Unit 6, Marietta, GA 30066 and is currently estimated at $633,687, approximately $282 per square foot. 2861 Landing Dr Unit 6 is a home located in Cobb County with nearby schools including Davis Elementary School, Mabry Middle School, and Lassiter High School.
Ownership History
Date
Name
Owned For
Owner Type
Purchase Details
Closed on
Oct 29, 1999
Sold by
Decaprio John F and Decaprio Kristine L
Bought by
Collins John W and Collins Maureen
Current Estimated Value
Home Financials for this Owner
Home Financials are based on the most recent Mortgage that was taken out on this home.
Original Mortgage
$185,300
Outstanding Balance
$55,651
Interest Rate
7.76%
Mortgage Type
New Conventional
Estimated Equity
$578,036
Purchase Details
Closed on
Mar 31, 1995
Sold by
Wickland Paul M Jacquelyn
Bought by
Decaprio John F Kristine L
Purchase Details
Closed on
Jan 4, 1994
Sold by
Binkley Dennis J Patricia
Bought by
Wicklund Paul M Jacquelyn
Home Financials for this Owner
Home Financials are based on the most recent Mortgage that was taken out on this home.
Original Mortgage
$126,300
Interest Rate
7.19%
Create a Home Valuation Report for This Property
The Home Valuation Report is an in-depth analysis detailing your home's value as well as a comparison with similar homes in the area
Home Values in the Area
Average Home Value in this Area
Purchase History
| Date | Buyer | Sale Price | Title Company |
|---|---|---|---|
| Collins John W | $218,000 | -- | |
| Decaprio John F Kristine L | $182,000 | -- | |
| Wicklund Paul M Jacquelyn | $171,300 | -- |
Source: Public Records
Mortgage History
| Date | Status | Borrower | Loan Amount |
|---|---|---|---|
| Open | Collins John W | $185,300 | |
| Previous Owner | Wicklund Paul M Jacquelyn | $126,300 | |
| Closed | Decaprio John F Kristine L | $0 |
Source: Public Records
Tax History Compared to Growth
Tax History
| Year | Tax Paid | Tax Assessment Tax Assessment Total Assessment is a certain percentage of the fair market value that is determined by local assessors to be the total taxable value of land and additions on the property. | Land | Improvement |
|---|---|---|---|---|
| 2025 | $1,218 | $223,476 | $64,000 | $159,476 |
| 2024 | $1,222 | $223,476 | $64,000 | $159,476 |
| 2023 | $999 | $217,784 | $50,000 | $167,784 |
| 2022 | $1,113 | $186,824 | $44,000 | $142,824 |
| 2021 | $3,689 | $151,840 | $40,800 | $111,040 |
| 2020 | $3,689 | $151,840 | $40,800 | $111,040 |
| 2019 | $3,498 | $143,136 | $38,000 | $105,136 |
| 2018 | $3,498 | $143,136 | $38,000 | $105,136 |
| 2017 | $3,401 | $143,136 | $38,000 | $105,136 |
| 2016 | $3,270 | $136,848 | $36,000 | $100,848 |
| 2015 | $3,334 | $136,848 | $36,000 | $100,848 |
| 2014 | $2,820 | $113,008 | $0 | $0 |
Source: Public Records
Map
Nearby Homes
- 4259 Arbor Club Dr
- 2713 Arbor Summit
- 3043 Sawyer Trace NE
- 2855 Lamer Trace
- 4464 Windsor Oaks Dr
- 4397 Windsor Oaks Cir
- 2696 S Arbor Dr
- 3333 Devaughn Dr NE
- 4563 Ashmore Cir NE
- 3901 Hazelhurst Dr
- 3130 Maley Ct
- 2842 Forest Chase Dr NE
- 3798 Upland Dr
- 4589 Wigley Estates Rd
- 2578 Middle Coray Cir
- 4302 Highborne Dr NE Unit 3
- 2610 Chadwick Rd
- 3350 Brookhill Cir
- 2402 Woodbridge Dr
- 2859 Landing Dr
- 2858 Landing Dr
- 2857 Landing Dr
- 2865 Landing Dr Unit 6
- 4445 Windsor Oaks Cir
- 2862 Landing Dr
- 4197 Liberty Trace
- 4447 Windsor Oaks Cir Unit 5
- 2856 Landing Dr Unit 6
- 4449 Windsor Oaks Cir
- 4443 Windsor Oaks Cir Unit 5
- 2864 Landing Dr Unit 6
- 2855 Landing Dr
- 4441 Windsor Oaks Cir
- 4451 Windsor Oaks Cir
- 2854 Landing Dr
- 4453 Windsor Oaks Cir
- 2873 Liberty Ct
- 4439 Windsor Oaks Cir
- 2853 Landing Dr