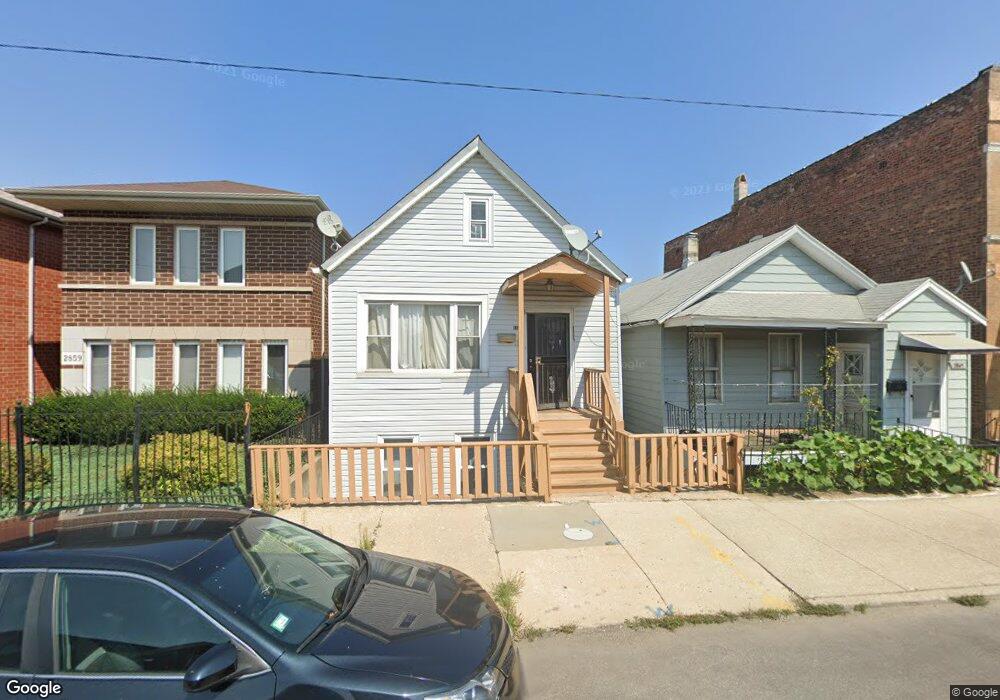
2861 S Keeley St Chicago, IL 60608
Bridgeport NeighborhoodEstimated Value: $450,000 - $691,000
3
Beds
2
Baths
1,576
Sq Ft
$372/Sq Ft
Est. Value
About This Home
This home is located at 2861 S Keeley St, Chicago, IL 60608 and is currently estimated at $586,113, approximately $371 per square foot. 2861 S Keeley St is a home located in Cook County with nearby schools including Holden Elementary School, St Therese School West, and St Barbara Elementary School.
Ownership History
Date
Name
Owned For
Owner Type
Purchase Details
Closed on
Oct 23, 2020
Sold by
Zhou Michael and Zhou Yong
Bought by
Su Zhipeng and Yu Guangfei
Current Estimated Value
Home Financials for this Owner
Home Financials are based on the most recent Mortgage that was taken out on this home.
Original Mortgage
$323,000
Outstanding Balance
$96,910
Interest Rate
2.8%
Mortgage Type
New Conventional
Estimated Equity
$489,203
Purchase Details
Closed on
Nov 30, 2015
Sold by
Ng Anthony and Chan Polly Man L
Bought by
Zhou Michael and Zhou Yong
Home Financials for this Owner
Home Financials are based on the most recent Mortgage that was taken out on this home.
Original Mortgage
$280,000
Interest Rate
2.87%
Mortgage Type
New Conventional
Purchase Details
Closed on
May 5, 2004
Sold by
Madia Russell J and Madia Christine L
Bought by
Ng Shiu M and Chan Polly Man L
Home Financials for this Owner
Home Financials are based on the most recent Mortgage that was taken out on this home.
Original Mortgage
$273,000
Interest Rate
1.75%
Mortgage Type
Negative Amortization
Create a Home Valuation Report for This Property
The Home Valuation Report is an in-depth analysis detailing your home's value as well as a comparison with similar homes in the area
Home Values in the Area
Average Home Value in this Area
Purchase History
| Date | Buyer | Sale Price | Title Company |
|---|---|---|---|
| Su Zhipeng | $450,000 | Chicago Title | |
| Zhou Michael | $380,000 | Ct | |
| Ng Shiu M | $341,500 | Ticor Title Insurance |
Source: Public Records
Mortgage History
| Date | Status | Borrower | Loan Amount |
|---|---|---|---|
| Open | Su Zhipeng | $323,000 | |
| Previous Owner | Zhou Michael | $280,000 | |
| Previous Owner | Ng Shiu M | $273,000 |
Source: Public Records
Tax History Compared to Growth
Tax History
| Year | Tax Paid | Tax Assessment Tax Assessment Total Assessment is a certain percentage of the fair market value that is determined by local assessors to be the total taxable value of land and additions on the property. | Land | Improvement |
|---|---|---|---|---|
| 2024 | $5,899 | $42,000 | $13,068 | $28,932 |
| 2023 | $5,792 | $35,000 | $10,560 | $24,440 |
| 2022 | $5,792 | $35,000 | $10,560 | $24,440 |
| 2021 | $5,833 | $35,000 | $10,560 | $24,440 |
| 2020 | $6,104 | $30,504 | $8,448 | $22,056 |
| 2019 | $6,121 | $33,894 | $8,448 | $25,446 |
| 2018 | $6,017 | $33,894 | $8,448 | $25,446 |
| 2017 | $6,366 | $32,947 | $6,600 | $26,347 |
| 2016 | $6,099 | $32,947 | $6,600 | $26,347 |
| 2015 | $5,557 | $32,947 | $6,600 | $26,347 |
| 2014 | $5,095 | $30,030 | $5,280 | $24,750 |
| 2013 | $4,983 | $30,030 | $5,280 | $24,750 |
Source: Public Records
Map
Nearby Homes
- 2837 S Farrell St
- 2879 S Throop St
- 2948 S Lyman St
- 2725 S Quinn St
- 2819 S Quinn St
- 2922 S Keeley St
- 2935 S Throop St
- 2947 S Farrell St
- 2812 S Quinn St
- 2713 S Crowell St
- 2850 S Poplar Ave
- 2520 S Stark St
- 2517 S Mary St
- 4936 S Loomis St
- 928 W 29th St
- 2859 S Hillock Ave
- 1226 W 31st Place
- 1312 W 31st St
- 2807 S Halsted St Unit 201
- 2807 S Halsted St Unit 204
- 2859 S Keeley St
- 2857 S Keeley St
- 2863 S Keeley St
- 2865 S Keeley St
- 2855 S Keeley St Unit 1
- 2867 S Keeley St
- 2867 S Keeley St
- 2849 S Keeley St
- 2861 S Farrell St
- 2861 S Farrell St Unit first floor
- 2861 S Farrell St Unit Garden Apartment
- 2863 S Farrell St
- 2847 S Keeley St
- 2865 S Farrell St
- 2857 S Farrell St
- 2853 S Farrell St Unit 2
- 2853 S Farrell St
- 2867 S Farrell St
- 2867 S Farrell St
- 2845 S Keeley St