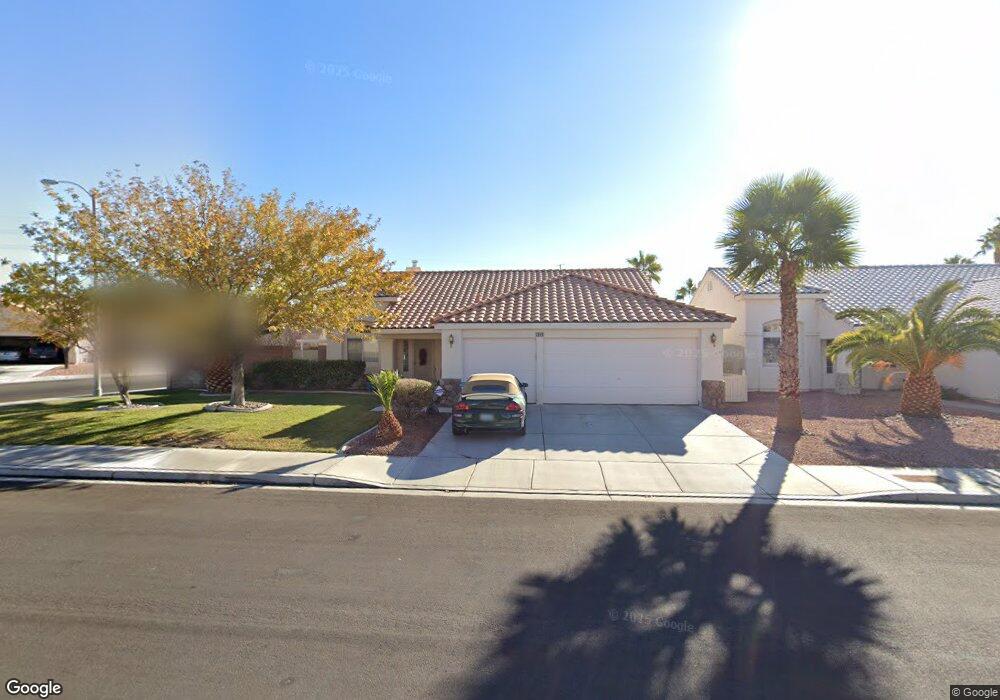
2863 Skowhegan Dr Henderson, NV 89074
Southfork NeighborhoodEstimated Value: $523,000 - $557,000
4
Beds
2
Baths
1,728
Sq Ft
$315/Sq Ft
Est. Value
About This Home
This home is located at 2863 Skowhegan Dr, Henderson, NV 89074 and is currently estimated at $543,545, approximately $314 per square foot. 2863 Skowhegan Dr is a home located in Clark County with nearby schools including Glen C. Taylor Elementary School, Bob Miller Middle School, and Coronado High School.
Ownership History
Date
Name
Owned For
Owner Type
Purchase Details
Closed on
Jul 22, 2004
Sold by
Marckwardt Marc W
Bought by
Drury Robert C and Drury Monyeen C
Current Estimated Value
Home Financials for this Owner
Home Financials are based on the most recent Mortgage that was taken out on this home.
Original Mortgage
$299,920
Outstanding Balance
$143,914
Interest Rate
5.62%
Mortgage Type
Unknown
Estimated Equity
$399,631
Purchase Details
Closed on
Jul 31, 2003
Sold by
Apana Roger B and Apana Edmay
Bought by
Marckwardt Marc W and The Marckwardt Trust
Purchase Details
Closed on
Dec 10, 1996
Sold by
Westgate Properties Ltd
Bought by
Apana Roger B and Apana Edmay
Home Financials for this Owner
Home Financials are based on the most recent Mortgage that was taken out on this home.
Original Mortgage
$158,450
Interest Rate
7.76%
Create a Home Valuation Report for This Property
The Home Valuation Report is an in-depth analysis detailing your home's value as well as a comparison with similar homes in the area
Home Values in the Area
Average Home Value in this Area
Purchase History
| Date | Buyer | Sale Price | Title Company |
|---|---|---|---|
| Drury Robert C | $374,900 | Lawyers Title Of Nevada | |
| Marckwardt Marc W | $235,000 | Fidelity National Title | |
| Apana Roger B | $140,500 | National Title Company |
Source: Public Records
Mortgage History
| Date | Status | Borrower | Loan Amount |
|---|---|---|---|
| Open | Drury Robert C | $299,920 | |
| Previous Owner | Apana Roger B | $158,450 | |
| Closed | Drury Robert C | $74,980 |
Source: Public Records
Tax History Compared to Growth
Tax History
| Year | Tax Paid | Tax Assessment Tax Assessment Total Assessment is a certain percentage of the fair market value that is determined by local assessors to be the total taxable value of land and additions on the property. | Land | Improvement |
|---|---|---|---|---|
| 2025 | $1,956 | $121,640 | $48,300 | $73,340 |
| 2024 | $1,900 | $121,640 | $48,300 | $73,340 |
| 2023 | $1,900 | $109,835 | $40,250 | $69,585 |
| 2022 | $1,854 | $98,246 | $34,300 | $63,946 |
| 2021 | $1,891 | $95,186 | $34,300 | $60,886 |
| 2020 | $1,748 | $94,839 | $34,300 | $60,539 |
| 2019 | $1,698 | $94,019 | $34,300 | $59,719 |
| 2018 | $1,650 | $78,431 | $20,650 | $57,781 |
| 2017 | $2,097 | $77,630 | $18,900 | $58,730 |
| 2016 | $1,561 | $71,120 | $12,250 | $58,870 |
| 2015 | $1,559 | $71,911 | $13,650 | $58,261 |
| 2014 | $1,513 | $55,893 | $8,750 | $47,143 |
Source: Public Records
Map
Nearby Homes
- 2859 Cordillera Dr
- 427 Rhythm St
- 500 Quail Bird Place
- 420 Rhythm St
- 502 Crepes Place
- 448 Temple Canyon Place
- 502 Crumpler Place
- 510 Cosmic Star Place
- 2753 Saigon Dr
- 511 Rafkin Place
- 529 Quail Bird Place
- 2907 Rio Sonora Ct
- 690 Turtlewood Place
- 0 Richmar Ave
- 2827 Richmar Ave
- 0 Delano Dr
- 3020 Delano Dr
- 691 Vineland Ave
- 2667 Hourglass Dr
- 2916 Candelaria Dr
- 2865 Skowhegan Dr Unit 2
- 2867 Skowhegan Dr
- 2862 Cordillera Dr
- 2854 Cordillera Dr
- 2857 Cordillera Dr
- 2855 Cordillera Dr
- 2861 Cordillera Dr
- 2864 Skowhegan Dr
- 2859 Skowhegan Dr
- 2869 Skowhegan Dr
- 2863 Cordillera Dr
- 2858 Skowhegan Dr
- 2866 Skowhegan Dr
- 2852 Cordillera Dr
- 2864 Cordillera Dr
- 2857 Skowhegan Dr
- 2871 Skowhegan Dr Unit 2
- 2865 Cordillera Dr
- 2868 Skowhegan Dr
- 2866 Cordillera Dr