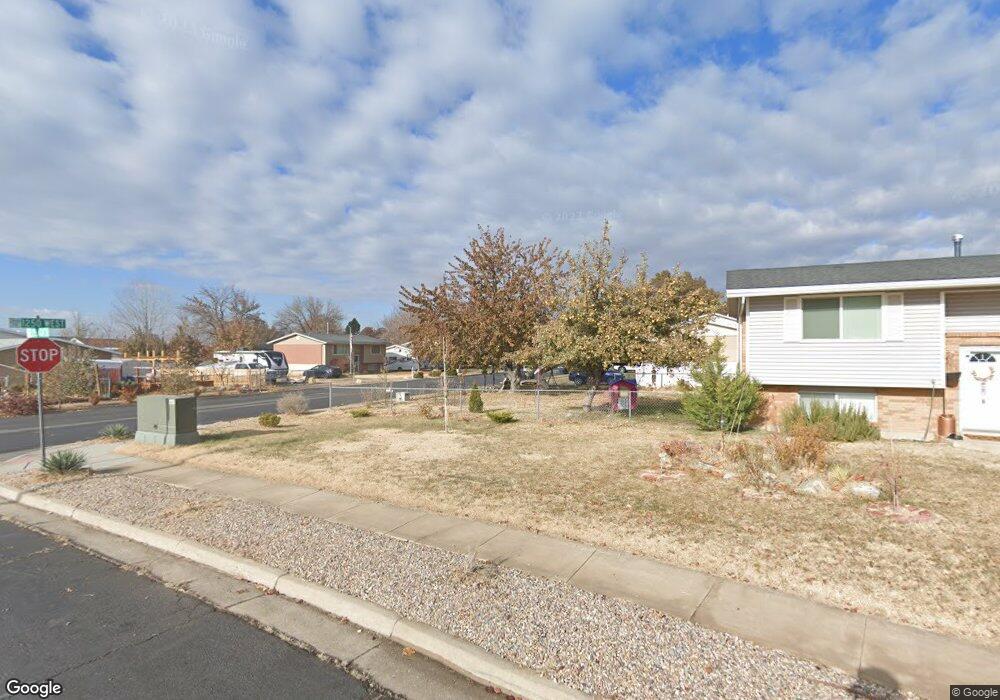
2863 W 2175 N Clearfield, UT 84015
Estimated Value: $533,000 - $604,525
5
Beds
3
Baths
3,384
Sq Ft
$168/Sq Ft
Est. Value
About This Home
This home is located at 2863 W 2175 N, Clearfield, UT 84015 and is currently estimated at $568,881, approximately $168 per square foot. 2863 W 2175 N is a home located in Davis County with nearby schools including West Clinton Elementary School, West Point Junior High School, and Clearfield High School.
Ownership History
Date
Name
Owned For
Owner Type
Purchase Details
Closed on
Feb 25, 2009
Sold by
Hunter Stephanie and Hunter Stephen A
Bought by
Marten Chad A and Kelley Jennifer
Current Estimated Value
Home Financials for this Owner
Home Financials are based on the most recent Mortgage that was taken out on this home.
Original Mortgage
$244,505
Outstanding Balance
$152,979
Interest Rate
4.91%
Mortgage Type
FHA
Estimated Equity
$415,902
Purchase Details
Closed on
Mar 1, 2004
Sold by
Chapman Steven R and Chapman Leslie A
Bought by
Hunter Stephen A and Hunter Stephanie
Purchase Details
Closed on
Dec 7, 2001
Sold by
Woodside Homes Corp
Bought by
Chapman Steven R and Chapman Leslie A
Home Financials for this Owner
Home Financials are based on the most recent Mortgage that was taken out on this home.
Original Mortgage
$137,800
Interest Rate
6.57%
Create a Home Valuation Report for This Property
The Home Valuation Report is an in-depth analysis detailing your home's value as well as a comparison with similar homes in the area
Home Values in the Area
Average Home Value in this Area
Purchase History
| Date | Buyer | Sale Price | Title Company |
|---|---|---|---|
| Marten Chad A | -- | First American Title | |
| Hunter Stephen A | -- | First American Title Co Ut | |
| Chapman Steven R | -- | First American Title Co |
Source: Public Records
Mortgage History
| Date | Status | Borrower | Loan Amount |
|---|---|---|---|
| Open | Marten Chad A | $244,505 | |
| Previous Owner | Chapman Steven R | $137,800 |
Source: Public Records
Tax History Compared to Growth
Tax History
| Year | Tax Paid | Tax Assessment Tax Assessment Total Assessment is a certain percentage of the fair market value that is determined by local assessors to be the total taxable value of land and additions on the property. | Land | Improvement |
|---|---|---|---|---|
| 2025 | -- | $298,650 | $109,474 | $189,176 |
| 2024 | $2,952 | $304,150 | $118,191 | $185,959 |
| 2023 | $2,952 | $528,000 | $138,247 | $389,753 |
| 2022 | $3,169 | $313,500 | $80,011 | $233,489 |
| 2021 | $2,828 | $415,000 | $107,943 | $307,057 |
| 2020 | $2,485 | $361,000 | $96,097 | $264,903 |
| 2019 | $2,389 | $339,000 | $104,293 | $234,707 |
| 2018 | $2,188 | $305,000 | $87,090 | $217,910 |
| 2016 | $1,970 | $141,790 | $34,786 | $107,004 |
| 2015 | $1,968 | $134,695 | $34,786 | $99,909 |
| 2014 | $1,917 | $133,259 | $34,786 | $98,473 |
| 2013 | -- | $130,699 | $30,667 | $100,032 |
Source: Public Records
Map
Nearby Homes
- 1958 N 2750 W
- 3941 W 1800 N
- Harvard Plan at Summerfield - Enclave
- 2208 W 2615 N
- Linden Plan at Summerfield - Vista
- Yale Plan at Summerfield - Enclave
- Gambel Oak Plan at Summerfield - Vista
- Cedar Plan at Summerfield - Vista
- Elm Plan at Summerfield - Vista
- Princeton Plan at Summerfield - Enclave
- Cambridge Plan at Summerfield - Enclave
- Cornell Plan at Summerfield - Enclave
- Sycamore Plan at Summerfield - Vista
- Berkeley Plan at Summerfield - Enclave
- Birch Plan at Summerfield - Vista
- Stanford Plan at Summerfield - Enclave
- 2322 N 2500 W
- 339 N 3250 W Unit 12
- 3298 W 2300 N
- 2434 W 2250 N