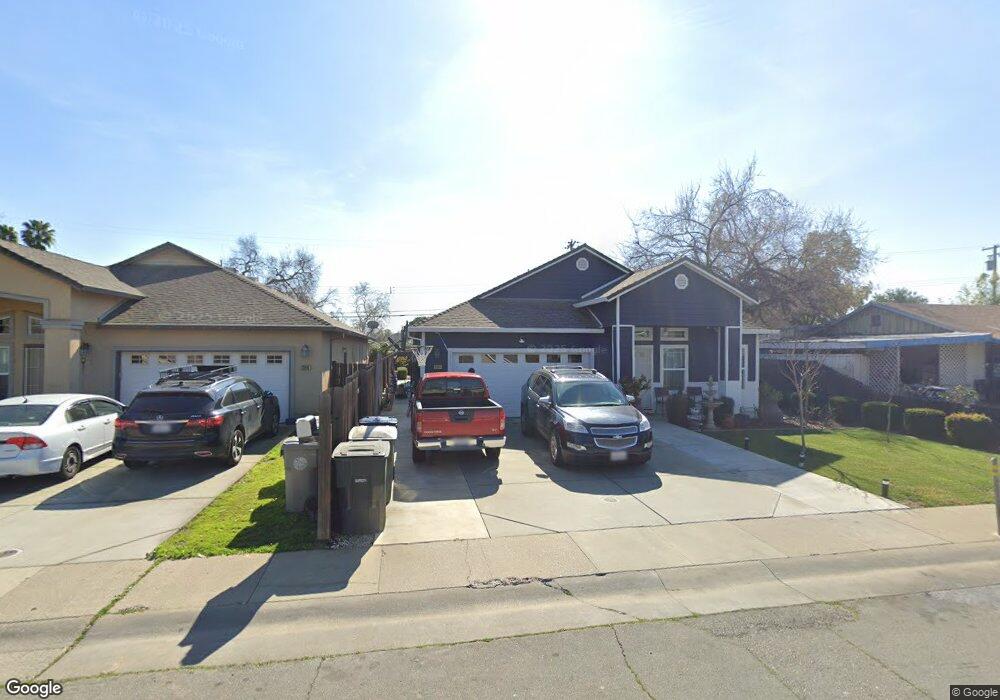
2864 34th Ave Sacramento, CA 95824
South City Farms NeighborhoodEstimated Value: $144,000 - $468,038
4
Beds
2
Baths
1,775
Sq Ft
$213/Sq Ft
Est. Value
About This Home
This home is located at 2864 34th Ave, Sacramento, CA 95824 and is currently estimated at $378,510, approximately $213 per square foot. 2864 34th Ave is a home located in Sacramento County with nearby schools including Ethel Phillips Elementary School, Rosa Parks Elementary School, and C. K. McClatchy High.
Ownership History
Date
Name
Owned For
Owner Type
Purchase Details
Closed on
Dec 8, 2011
Sold by
Fannie Mae
Bought by
Gonzalez Casimiro Ruiz and Rodriguez Sonia Vega
Current Estimated Value
Home Financials for this Owner
Home Financials are based on the most recent Mortgage that was taken out on this home.
Original Mortgage
$121,319
Outstanding Balance
$82,711
Interest Rate
3.94%
Mortgage Type
FHA
Estimated Equity
$295,799
Purchase Details
Closed on
Apr 26, 2011
Sold by
Marlow Bailey Valerie
Bought by
Fannie Mae and Federal National Mortgage Association
Purchase Details
Closed on
Jun 1, 2007
Sold by
Srm Industries Inc
Bought by
Marlow Bailey Valerie
Home Financials for this Owner
Home Financials are based on the most recent Mortgage that was taken out on this home.
Original Mortgage
$310,000
Interest Rate
6.14%
Mortgage Type
Purchase Money Mortgage
Create a Home Valuation Report for This Property
The Home Valuation Report is an in-depth analysis detailing your home's value as well as a comparison with similar homes in the area
Home Values in the Area
Average Home Value in this Area
Purchase History
| Date | Buyer | Sale Price | Title Company |
|---|---|---|---|
| Gonzalez Casimiro Ruiz | $115,000 | Old Republic Title Company | |
| Fannie Mae | $388,680 | Accommodation | |
| Marlow Bailey Valerie | $310,000 | Alliance Title Company |
Source: Public Records
Mortgage History
| Date | Status | Borrower | Loan Amount |
|---|---|---|---|
| Open | Gonzalez Casimiro Ruiz | $121,319 | |
| Previous Owner | Marlow Bailey Valerie | $310,000 |
Source: Public Records
Tax History
| Year | Tax Paid | Tax Assessment Tax Assessment Total Assessment is a certain percentage of the fair market value that is determined by local assessors to be the total taxable value of land and additions on the property. | Land | Improvement |
|---|---|---|---|---|
| 2025 | $1,891 | $144,433 | $62,796 | $81,637 |
| 2024 | $1,891 | $141,602 | $61,565 | $80,037 |
| 2023 | $1,844 | $138,826 | $60,358 | $78,468 |
| 2022 | $1,809 | $136,105 | $59,175 | $76,930 |
| 2021 | $1,727 | $133,437 | $58,015 | $75,422 |
| 2020 | $1,734 | $132,070 | $57,421 | $74,649 |
| 2019 | $1,696 | $129,482 | $56,296 | $73,186 |
| 2018 | $1,650 | $126,944 | $55,193 | $71,751 |
| 2017 | $1,625 | $124,456 | $54,111 | $70,345 |
| 2016 | $1,553 | $122,016 | $53,050 | $68,966 |
| 2015 | $1,528 | $120,185 | $52,254 | $67,931 |
| 2014 | $1,453 | $117,832 | $51,231 | $66,601 |
Source: Public Records
Map
Nearby Homes
- 3080 34th Ave
- 2740 29th Ave
- 2525 Encinal Ave
- 3109 29th Ave
- 2580 26th Ave
- 3450 27th Ave
- 3807 32nd Ave
- 3721 40th Ave
- 6006 Martin Luther King Junior Blvd
- 3636 27th Ave
- 2325 Glen Ellen Cir
- 3712 42nd Ave
- 3890 Fruitridge Rd
- 2536 47th Ave
- 3711 46th Ave
- 3620 24th Ave
- 3341 23rd Ave
- 3930 41st Ave
- 5070 Martin Luther King Junior Blvd
- 3433 22nd Ave
Your Personal Tour Guide
Ask me questions while you tour the home.