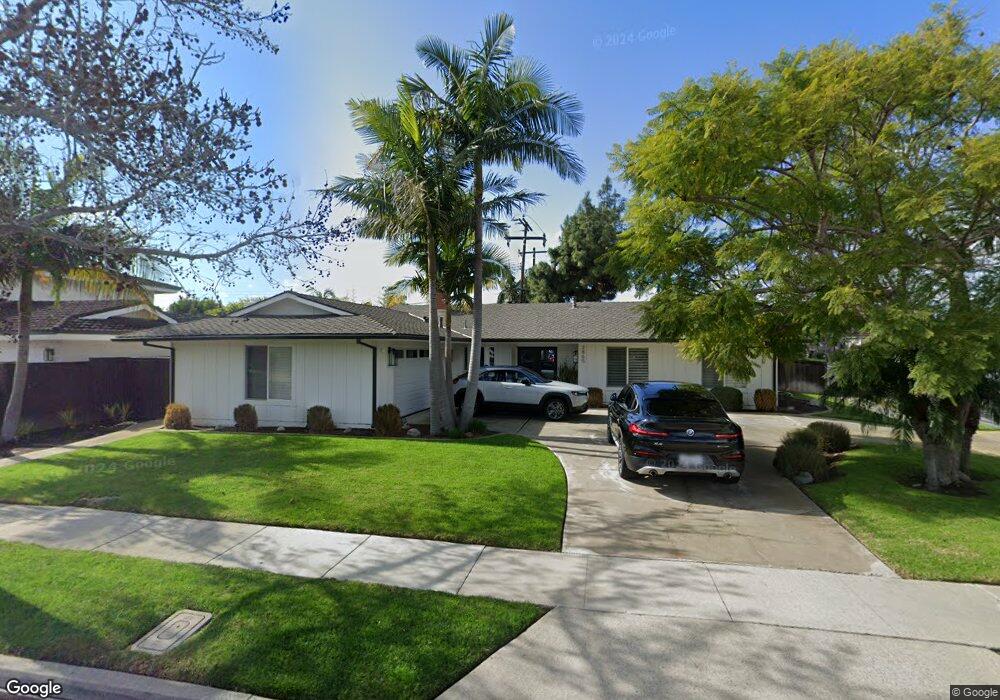
2865 Chios Rd Costa Mesa, CA 92626
Mesa Verde NeighborhoodEstimated Value: $1,622,847 - $1,968,000
4
Beds
2
Baths
1,717
Sq Ft
$1,041/Sq Ft
Est. Value
About This Home
This home is located at 2865 Chios Rd, Costa Mesa, CA 92626 and is currently estimated at $1,787,462, approximately $1,041 per square foot. 2865 Chios Rd is a home located in Orange County with nearby schools including Adams Elementary School, Charles W. Tewinkle Middle School, and Estancia High School.
Ownership History
Date
Name
Owned For
Owner Type
Purchase Details
Closed on
Aug 10, 1999
Sold by
Jeffrey Graham and Jeffrey Katherine
Bought by
Burns Vincent A and Burns Sylvia A
Current Estimated Value
Home Financials for this Owner
Home Financials are based on the most recent Mortgage that was taken out on this home.
Original Mortgage
$284,800
Outstanding Balance
$79,287
Interest Rate
7.25%
Estimated Equity
$1,708,175
Purchase Details
Closed on
Jun 3, 1998
Sold by
Scott Graham Jeffrey
Bought by
Graham Jeffrey Scott and Graham Katherine A
Home Financials for this Owner
Home Financials are based on the most recent Mortgage that was taken out on this home.
Original Mortgage
$217,500
Interest Rate
7.17%
Create a Home Valuation Report for This Property
The Home Valuation Report is an in-depth analysis detailing your home's value as well as a comparison with similar homes in the area
Home Values in the Area
Average Home Value in this Area
Purchase History
| Date | Buyer | Sale Price | Title Company |
|---|---|---|---|
| Burns Vincent A | $356,000 | First American Title Ins Co | |
| Graham Jeffrey Scott | -- | Fidelity National Title Ins |
Source: Public Records
Mortgage History
| Date | Status | Borrower | Loan Amount |
|---|---|---|---|
| Open | Burns Vincent A | $284,800 | |
| Previous Owner | Graham Jeffrey Scott | $217,500 | |
| Closed | Burns Vincent A | $35,600 |
Source: Public Records
Tax History
| Year | Tax Paid | Tax Assessment Tax Assessment Total Assessment is a certain percentage of the fair market value that is determined by local assessors to be the total taxable value of land and additions on the property. | Land | Improvement |
|---|---|---|---|---|
| 2025 | $6,582 | $547,152 | $421,252 | $125,900 |
| 2024 | $6,582 | $536,424 | $412,992 | $123,432 |
| 2023 | $6,358 | $525,906 | $404,894 | $121,012 |
| 2022 | $6,141 | $515,595 | $396,955 | $118,640 |
| 2021 | $5,957 | $505,486 | $389,172 | $116,314 |
| 2020 | $5,885 | $500,303 | $385,181 | $115,122 |
| 2019 | $5,759 | $490,494 | $377,629 | $112,865 |
| 2018 | $5,643 | $480,877 | $370,225 | $110,652 |
| 2017 | $5,548 | $471,449 | $362,966 | $108,483 |
| 2016 | $5,430 | $462,205 | $355,849 | $106,356 |
| 2015 | $5,377 | $455,263 | $350,504 | $104,759 |
| 2014 | $5,255 | $446,346 | $343,639 | $102,707 |
Source: Public Records
Map
Nearby Homes
- 2046 Calvert Ave
- 3058 Club House Rd
- 2045 Goldeneye Place
- 2820 Stromboli Rd
- 10362 Monitor Dr
- 2065 Phalarope Ct
- 19941 Carmania Ln
- 2021 Swan Dr
- 19350 Ward St Unit 38
- 19350 Ward St Unit 72
- 19350 Ward St Unit 54
- 19350 Ward St Unit 73
- 19350 Ward St Unit 12
- 19350 S Ward St Unit 3
- 19622 Canberra Ln
- 10226 Holburn Dr
- 19691 Canberra Ln
- 10210 Holburn Dr
- 19837 Margate Ln
- 10172 Ascot Cir
Your Personal Tour Guide
Ask me questions while you tour the home.