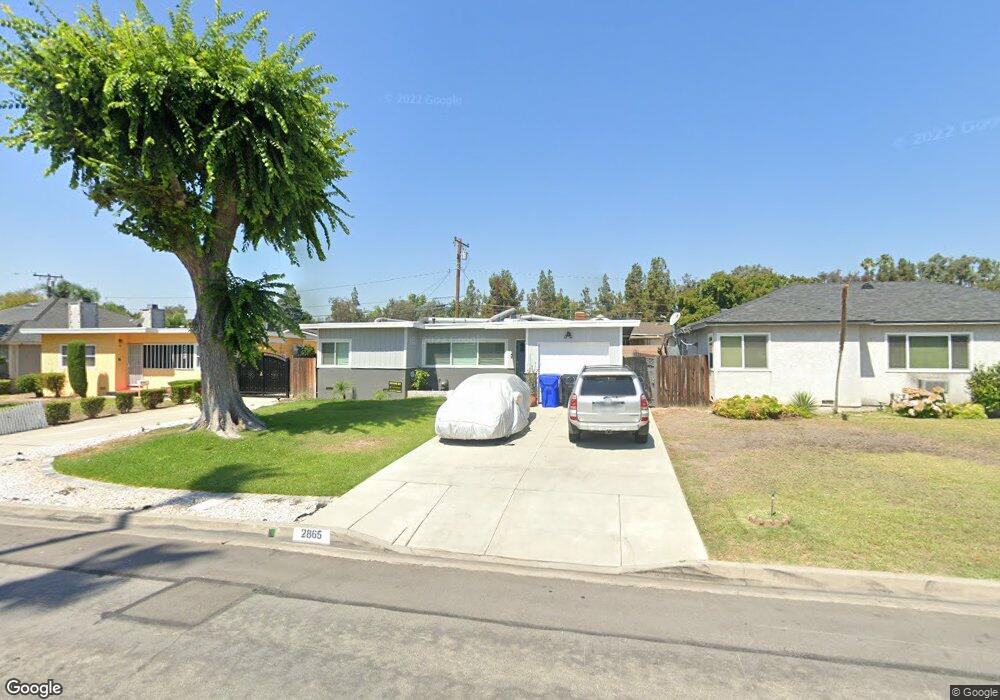
2865 Foss Ave Arcadia, CA 91006
Mayflower Village NeighborhoodEstimated Value: $773,656 - $798,000
2
Beds
1
Bath
842
Sq Ft
$934/Sq Ft
Est. Value
About This Home
This home is located at 2865 Foss Ave, Arcadia, CA 91006 and is currently estimated at $786,164, approximately $933 per square foot. 2865 Foss Ave is a home located in Los Angeles County with nearby schools including Plymouth Elementary School, Santa Fe Computer Science Magnet, and Monrovia High School.
Ownership History
Date
Name
Owned For
Owner Type
Purchase Details
Closed on
Feb 1, 2017
Sold by
Sandoval Anthony F
Bought by
Sandoval Anthony F and Sandoval Tiffany R
Current Estimated Value
Home Financials for this Owner
Home Financials are based on the most recent Mortgage that was taken out on this home.
Original Mortgage
$254,375
Interest Rate
4.12%
Mortgage Type
FHA
Purchase Details
Closed on
Nov 23, 2014
Sold by
Sandoval Cytnhia
Bought by
Sandoval Anthony F
Purchase Details
Closed on
May 10, 1998
Sold by
Manders Esperanza
Bought by
Sandoval Cynthia L
Create a Home Valuation Report for This Property
The Home Valuation Report is an in-depth analysis detailing your home's value as well as a comparison with similar homes in the area
Home Values in the Area
Average Home Value in this Area
Purchase History
| Date | Buyer | Sale Price | Title Company |
|---|---|---|---|
| Sandoval Anthony F | -- | None Available | |
| Sandoval Anthony F | -- | None Available | |
| Sandoval Cynthia L | -- | -- |
Source: Public Records
Mortgage History
| Date | Status | Borrower | Loan Amount |
|---|---|---|---|
| Closed | Sandoval Anthony F | $254,375 |
Source: Public Records
Tax History
| Year | Tax Paid | Tax Assessment Tax Assessment Total Assessment is a certain percentage of the fair market value that is determined by local assessors to be the total taxable value of land and additions on the property. | Land | Improvement |
|---|---|---|---|---|
| 2025 | $3,853 | $294,597 | $254,128 | $40,469 |
| 2024 | $3,853 | $288,822 | $249,146 | $39,676 |
| 2023 | $3,764 | $283,160 | $244,261 | $38,899 |
| 2022 | $3,653 | $277,609 | $239,472 | $38,137 |
| 2021 | $3,581 | $272,167 | $234,777 | $37,390 |
| 2019 | $3,411 | $264,096 | $227,814 | $36,282 |
| 2018 | $3,298 | $258,919 | $223,348 | $35,571 |
| 2016 | $3,169 | $248,867 | $214,676 | $34,191 |
| 2015 | $830 | $46,865 | $28,938 | $17,927 |
| 2014 | $830 | $45,948 | $28,372 | $17,576 |
Source: Public Records
Map
Nearby Homes
- 2880 Foss Ave
- 2813 Weidermeyer Ave
- 2809 Weidermeyer Ave
- 2808 Weidermeyer Ave
- 4185 Jasmine Ln
- 4183 Jasmine Ln
- 4181 Jasmine Ln
- 4179 Jasmine Ln
- 4175 Jasmine Ln
- 4203 Jasmine Ln
- 4201 Jasmine Ln
- 4205 Jasmine Ln
- 4207 Jasmine Ln
- 4209 Jasmine Ln
- 4211 Jasmine Ln
- 4210 Jasmine Ln
- 4223 Jasmine Ln
- 4221 Jasmine Ln
- 4219 Jasmine Ln
- 4216 Jasmine Ln
Your Personal Tour Guide
Ask me questions while you tour the home.