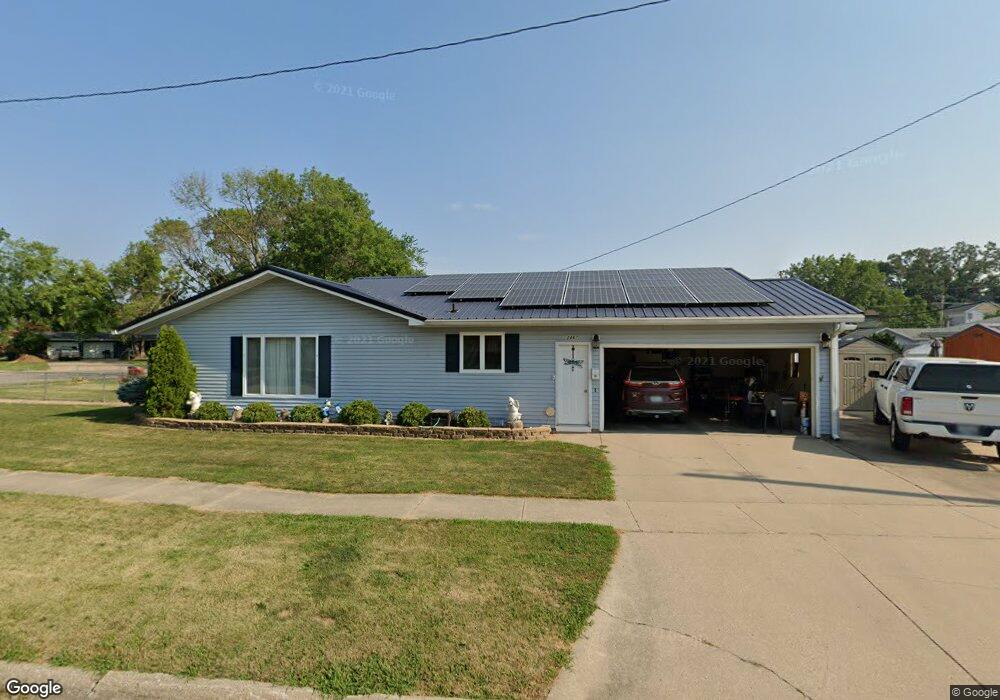
2867 Henry Ct NW Cedar Rapids, IA 52405
Estimated Value: $228,000 - $249,000
4
Beds
2
Baths
1,952
Sq Ft
$122/Sq Ft
Est. Value
About This Home
This home is located at 2867 Henry Ct NW, Cedar Rapids, IA 52405 and is currently estimated at $237,817, approximately $121 per square foot. 2867 Henry Ct NW is a home located in Linn County with nearby schools including Junction City Elementary School, Cleveland Elementary School, and Kentucky Tech - Ashland Reg Tech Center.
Ownership History
Date
Name
Owned For
Owner Type
Purchase Details
Closed on
Aug 25, 2021
Sold by
Vanfleet Steven Craig and Vanfleet Van Fleet
Bought by
Vanfleet Steven Craig and Vanfleet Van Fleet
Current Estimated Value
Purchase Details
Closed on
Nov 13, 2018
Sold by
Pernicka Zequiel S
Bought by
Pernicka Larry
Purchase Details
Closed on
Nov 13, 2014
Sold by
Rajtora Donald R and Rajtora Ann B
Bought by
Black Aileen Sue
Purchase Details
Closed on
May 25, 2010
Sold by
Kimball Daniel H
Bought by
Vanfleet Steven Craig
Home Financials for this Owner
Home Financials are based on the most recent Mortgage that was taken out on this home.
Original Mortgage
$138,938
Interest Rate
4.97%
Mortgage Type
VA
Create a Home Valuation Report for This Property
The Home Valuation Report is an in-depth analysis detailing your home's value as well as a comparison with similar homes in the area
Home Values in the Area
Average Home Value in this Area
Purchase History
| Date | Buyer | Sale Price | Title Company |
|---|---|---|---|
| Vanfleet Steven Craig | -- | None Available | |
| Pernicka Larry | -- | None Available | |
| Pernicka Larry | -- | None Available | |
| Black Aileen Sue | $130,000 | None Available | |
| Vanfleet Steven Craig | $134,000 | None Available |
Source: Public Records
Mortgage History
| Date | Status | Borrower | Loan Amount |
|---|---|---|---|
| Previous Owner | Vanfleet Steven Craig | $138,938 |
Source: Public Records
Tax History Compared to Growth
Tax History
| Year | Tax Paid | Tax Assessment Tax Assessment Total Assessment is a certain percentage of the fair market value that is determined by local assessors to be the total taxable value of land and additions on the property. | Land | Improvement |
|---|---|---|---|---|
| 2025 | $3,132 | $222,900 | $35,700 | $187,200 |
| 2024 | $3,892 | $203,100 | $27,100 | $176,000 |
| 2023 | $3,892 | $203,100 | $27,100 | $176,000 |
| 2022 | $3,552 | $196,800 | $27,100 | $169,700 |
| 2021 | $3,498 | $183,800 | $27,100 | $156,700 |
| 2020 | $3,498 | $170,400 | $22,800 | $147,600 |
| 2019 | $3,286 | $164,200 | $22,800 | $141,400 |
| 2018 | $3,190 | $164,200 | $22,800 | $141,400 |
| 2017 | $3,190 | $160,700 | $22,800 | $137,900 |
| 2016 | $3,345 | $160,700 | $22,800 | $137,900 |
| 2015 | $2,859 | $137,683 | $22,848 | $114,835 |
| 2014 | $2,674 | $137,683 | $22,848 | $114,835 |
| 2013 | $2,610 | $137,683 | $22,848 | $114,835 |
Source: Public Records
Map
Nearby Homes
- 623 27th St NW
- 615 27th St NW
- 425 28th St NW
- 912 29th St NW
- 2623 Iris Ave NW
- 451 23rd St NW
- 949 Westwood Dr NW
- 1410 Adair Ct SW Unit Lot 2
- 312 24th Ave NW
- 3312 G Ave NW
- 232 27th St NW
- 327 NW Edgewood Rd Unit 324, 330, 336, 342 C
- 3107 Johnson Ave NW Unit 4
- 225 31st St NW
- 3507 E Ave NW Unit F
- 3509 E Ave NW Unit D
- 159 26th St NW
- 3313 Crestwood Dr NW
- 1322 Woodside Dr NW
- 1860 E Ave NW
- 2861 Henry Ct NW
- 2722 Henry Ct NW
- 2803 Henry Ct NW
- 2729 Henry Ct NW
- 2855 Henry Ct NW
- 2723 Henry Ct NW
- 2718 Henry Ct NW
- 2811 Henry Ct NW
- 708 27th St NW
- 2847 Henry Ct NW
- 2717 Henry Ct NW
- 2823 Henry Ct NW
- 716 27th St NW
- 2829 Henry Ct NW
- 2730 E Ave NW
- 2804 E Ave NW
- 2724 E Ave NW
- 2841 Henry Ct NW
- 2812 E Ave NW
- 2718 E Ave NW