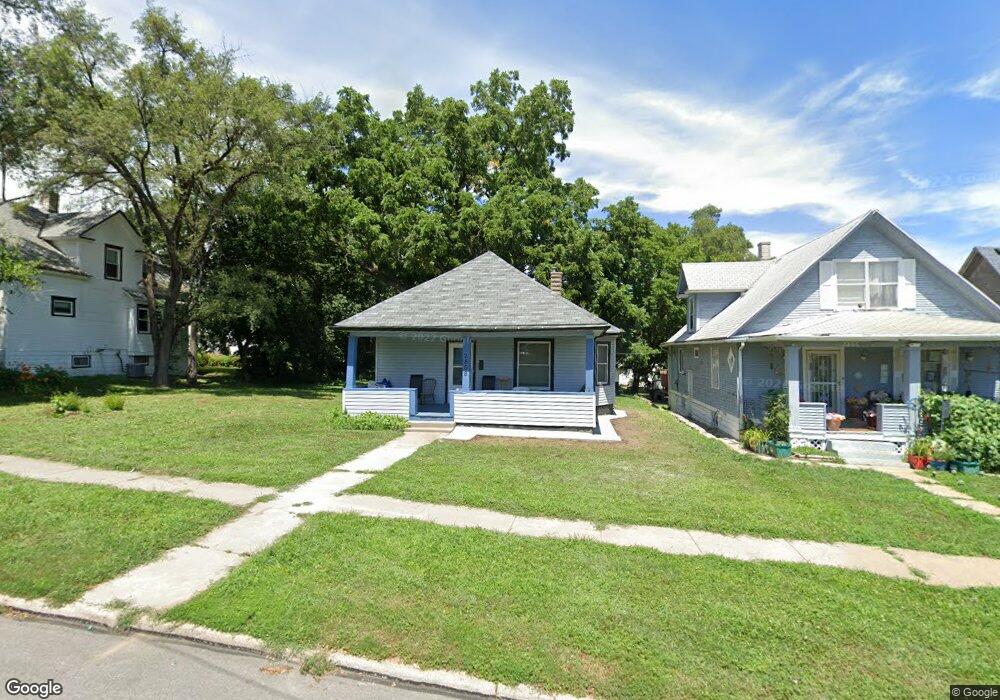
2868 Corby St Omaha, NE 68111
Lake-Bristol Square NeighborhoodEstimated Value: $92,000 - $137,000
2
Beds
1
Bath
891
Sq Ft
$136/Sq Ft
Est. Value
About This Home
This home is located at 2868 Corby St, Omaha, NE 68111 and is currently estimated at $121,358, approximately $136 per square foot. 2868 Corby St is a home located in Douglas County with nearby schools including Kennedy Elementary School, Monroe Middle School, and Benson Magnet High School.
Ownership History
Date
Name
Owned For
Owner Type
Purchase Details
Closed on
Feb 27, 2017
Sold by
Newsome Linda
Bought by
Williams Tranell
Current Estimated Value
Purchase Details
Closed on
Oct 23, 2010
Sold by
Newsome Linda and Williams Linda
Bought by
Williams Tranell and Randell Ashley
Home Financials for this Owner
Home Financials are based on the most recent Mortgage that was taken out on this home.
Original Mortgage
$42,000
Interest Rate
5%
Mortgage Type
Seller Take Back
Create a Home Valuation Report for This Property
The Home Valuation Report is an in-depth analysis detailing your home's value as well as a comparison with similar homes in the area
Home Values in the Area
Average Home Value in this Area
Purchase History
| Date | Buyer | Sale Price | Title Company |
|---|---|---|---|
| Williams Tranell | $43,000 | None Available | |
| Williams Tranell | $42,500 | None Available |
Source: Public Records
Mortgage History
| Date | Status | Borrower | Loan Amount |
|---|---|---|---|
| Closed | Williams Tranell | $42,000 |
Source: Public Records
Tax History Compared to Growth
Tax History
| Year | Tax Paid | Tax Assessment Tax Assessment Total Assessment is a certain percentage of the fair market value that is determined by local assessors to be the total taxable value of land and additions on the property. | Land | Improvement |
|---|---|---|---|---|
| 2024 | $1,734 | $99,600 | $9,500 | $90,100 |
| 2023 | $1,734 | $82,200 | $9,500 | $72,700 |
| 2022 | $1,370 | $64,200 | $9,500 | $54,700 |
| 2021 | $874 | $41,300 | $9,500 | $31,800 |
| 2020 | $884 | $41,300 | $9,500 | $31,800 |
| 2019 | $734 | $34,200 | $1,100 | $33,100 |
| 2018 | $735 | $34,200 | $1,100 | $33,100 |
| 2017 | $739 | $34,200 | $1,100 | $33,100 |
| 2016 | $976 | $45,500 | $1,000 | $44,500 |
| 2015 | $800 | $37,800 | $3,500 | $34,300 |
| 2014 | $800 | $37,800 | $3,500 | $34,300 |
Source: Public Records
Map
Nearby Homes