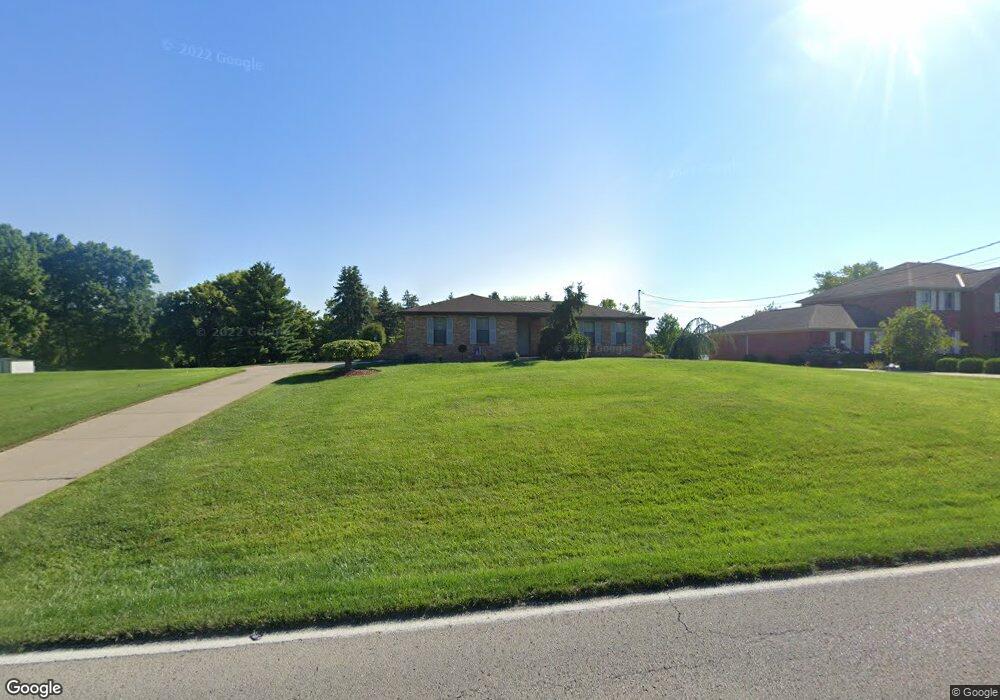
2868 Devils Backbone Rd Cincinnati, OH 45233
Estimated Value: $340,000 - $456,000
3
Beds
2
Baths
1,933
Sq Ft
$210/Sq Ft
Est. Value
About This Home
This home is located at 2868 Devils Backbone Rd, Cincinnati, OH 45233 and is currently estimated at $405,846, approximately $209 per square foot. 2868 Devils Backbone Rd is a home located in Hamilton County with nearby schools including John Foster Dulles Elementary School, Rapid Run Middle School, and Oak Hills High School.
Ownership History
Date
Name
Owned For
Owner Type
Purchase Details
Closed on
Apr 23, 2024
Sold by
Streckfuss Steven Craig and Streckfuss Beverly Jane
Bought by
Streckfuss Steven Craig and Streckfuss Beverly Jane
Current Estimated Value
Purchase Details
Closed on
Jun 14, 1993
Sold by
Arend Charles F Jr Tr
Bought by
Streckfuss Steven Craig
Create a Home Valuation Report for This Property
The Home Valuation Report is an in-depth analysis detailing your home's value as well as a comparison with similar homes in the area
Home Values in the Area
Average Home Value in this Area
Purchase History
| Date | Buyer | Sale Price | Title Company |
|---|---|---|---|
| Streckfuss Steven Craig | -- | None Listed On Document | |
| Streckfuss Steven Craig | -- | None Listed On Document | |
| Streckfuss Steven Craig | $150,000 | -- |
Source: Public Records
Tax History
| Year | Tax Paid | Tax Assessment Tax Assessment Total Assessment is a certain percentage of the fair market value that is determined by local assessors to be the total taxable value of land and additions on the property. | Land | Improvement |
|---|---|---|---|---|
| 2025 | $6,095 | $117,019 | $12,600 | $104,419 |
| 2024 | $5,943 | $117,019 | $12,600 | $104,419 |
| 2023 | $5,949 | $117,019 | $12,600 | $104,419 |
| 2022 | $4,755 | $79,226 | $11,760 | $67,466 |
| 2021 | $4,270 | $79,226 | $11,760 | $67,466 |
| 2020 | $4,325 | $79,226 | $11,760 | $67,466 |
| 2019 | $4,233 | $70,739 | $10,500 | $60,239 |
| 2018 | $4,239 | $70,739 | $10,500 | $60,239 |
| 2017 | $1,987 | $70,739 | $10,500 | $60,239 |
| 2016 | $3,896 | $68,873 | $10,353 | $58,520 |
| 2015 | $3,929 | $68,873 | $10,353 | $58,520 |
| 2014 | $3,935 | $68,873 | $10,353 | $58,520 |
| 2013 | $3,605 | $67,522 | $10,150 | $57,372 |
Source: Public Records
Map
Nearby Homes
- 2659 Devils Backbone Rd
- 2417 Quail Run Farm Ln
- 6944 Old Stone Ridge
- 2239 Quail Run Farm Ln
- 6233 Sharlene Dr
- 6090 Muddy Creek Rd
- 6040 Countrymeadow Ln
- 3388 Markdale Ct
- 6684 Powner Farm Dr
- 7284 Kirkridge Dr
- 5961 Lawrence Rd
- 3433 Tolland Ct
- 5918 Leeside Trail
- 1711 Ebenezer Rd
- 3311 Starhaven Trail
- 1659 Devils Backbone Rd
- 5869 Weston Ct
- 2 Ebenezer Rd
- 3454 Eyrich Rd
- 1259 Wexford Ln
- 2846 Devils Backbone Rd
- 2906 Devils Backbone Rd
- 2824 Devils Backbone Rd
- 2810 Devils Backbone Rd
- 2930 Devils Backbone Rd
- 2831 Devils Backbone Rd
- 6602 S Cove Dr
- 2794 Devils Backbone Rd
- 6604 S Cove Dr
- 2980 Devils Backbone Rd
- 6581 Werk Rd
- 2780 Devils Backbone Rd
- 2785 Devils Backbone Rd
- 6616 S Cove Dr
- 6601 S Cove Dr
- 2769 Devils Backbone Rd
- 6606 Woodcrest Dr
- 6628 S Cove Dr
- 2750 Devils Backbone Rd
- 2790 Devils Backbone Rd
Your Personal Tour Guide
Ask me questions while you tour the home.