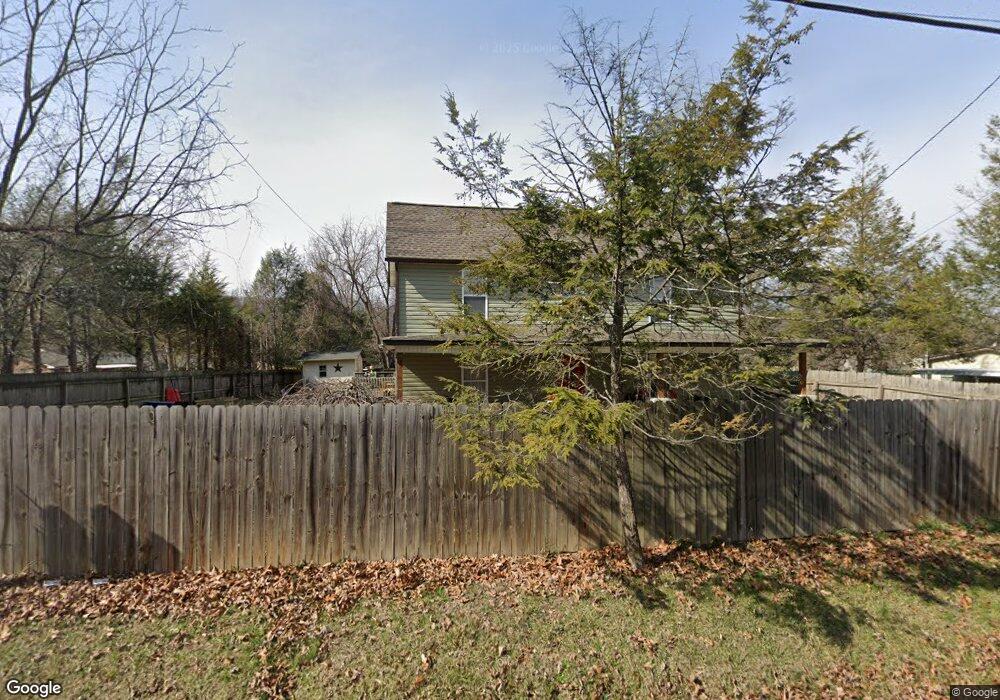
2868 Watauga Rd Johnson City, TN 37601
Estimated Value: $277,000 - $370,000
--
Bed
1
Bath
1,926
Sq Ft
$161/Sq Ft
Est. Value
About This Home
This home is located at 2868 Watauga Rd, Johnson City, TN 37601 and is currently estimated at $310,101, approximately $161 per square foot. 2868 Watauga Rd is a home located in Washington County with nearby schools including Fairmont Elementary School, Liberty Bell Middle School, and Indian Trail Middle School.
Ownership History
Date
Name
Owned For
Owner Type
Purchase Details
Closed on
Mar 15, 2011
Sold by
Vest Eddie Roger
Bought by
Davis Virgie and Ojeda Jose
Current Estimated Value
Home Financials for this Owner
Home Financials are based on the most recent Mortgage that was taken out on this home.
Original Mortgage
$58,000
Interest Rate
3.53%
Mortgage Type
Commercial
Purchase Details
Closed on
Sep 22, 1998
Sold by
Coffey George
Bought by
Ford William
Purchase Details
Closed on
Aug 5, 1998
Sold by
Vest Eddie Roger
Bought by
Coffey George
Purchase Details
Closed on
Jun 6, 1997
Sold by
Vest Eddie Roger
Bought by
Lane Dwight
Purchase Details
Closed on
Sep 29, 1992
Bought by
Vest Eddie Roger
Purchase Details
Closed on
Jul 29, 1992
Bought by
Jones Robin and Jones Kathy
Purchase Details
Closed on
Feb 21, 1990
Bought by
Jones Robin and Jones Kathy
Create a Home Valuation Report for This Property
The Home Valuation Report is an in-depth analysis detailing your home's value as well as a comparison with similar homes in the area
Home Values in the Area
Average Home Value in this Area
Purchase History
| Date | Buyer | Sale Price | Title Company |
|---|---|---|---|
| Davis Virgie | $59,000 | -- | |
| Ford William | $35,000 | -- | |
| Coffey George | $21,000 | -- | |
| Lane Dwight | $30,000 | -- | |
| Vest Eddie Roger | $22,500 | -- | |
| Jones Robin | $21,200 | -- | |
| Jones Robin | $20,000 | -- |
Source: Public Records
Mortgage History
| Date | Status | Borrower | Loan Amount |
|---|---|---|---|
| Previous Owner | Davis Virgie | $58,000 |
Source: Public Records
Tax History Compared to Growth
Tax History
| Year | Tax Paid | Tax Assessment Tax Assessment Total Assessment is a certain percentage of the fair market value that is determined by local assessors to be the total taxable value of land and additions on the property. | Land | Improvement |
|---|---|---|---|---|
| 2024 | $1,266 | $74,050 | $11,100 | $62,950 |
| 2022 | $399 | $18,550 | $6,675 | $11,875 |
| 2021 | $720 | $18,550 | $6,675 | $11,875 |
| 2020 | $716 | $18,550 | $6,675 | $11,875 |
| 2019 | $417 | $18,550 | $6,675 | $11,875 |
| 2018 | $748 | $17,525 | $6,675 | $10,850 |
| 2017 | $748 | $17,525 | $6,675 | $10,850 |
| 2016 | $745 | $17,525 | $6,675 | $10,850 |
| 2015 | $675 | $17,525 | $6,675 | $10,850 |
| 2014 | $631 | $17,525 | $6,675 | $10,850 |
Source: Public Records
Map
Nearby Homes
- 2856 Watauga Rd
- 126 Hughes St
- 807 Long St
- 570 Sedgewick Way
- 2239 E Fairview Ave
- 1213 Glynridge St
- 918 Riverview Dr
- 1448 Piedmont St
- 1917 Club Dr
- 2112 E Watauga Ave
- 2107 E Watauga Ave
- 909 Pine Grove Ave
- 1808 E Myrtle Ave
- 1620 Fairway Dr
- 604 Duke St
- 1701 E Millard St
- 1700 E Millard St
- Hillside Hillside Dr
- 119 Hillside Dr
- 107 S 2nd St
- 2870 Watauga Rd
- 1083 Snowden Terrace
- 2872 Watauga Rd
- 108 Hughes St
- 1091 Snowden Terrace
- 102 Dalewood Dr
- 102 E Watauga Ave
- 1069 Snowden Terrace
- 1011 Snowden Terrace
- 116 Hughes St
- 1033 Snowden Terrace
- 107 Hughes St
- 2855 Watauga Rd
- 101 Hughes St
- 1099 Snowden Terrace
- 109 Hughes St
- 120 Hughes St
- Lot 23 Snowden Terrace
- Lot 24 Snowden Terrace
- #20 Snowden Terrace