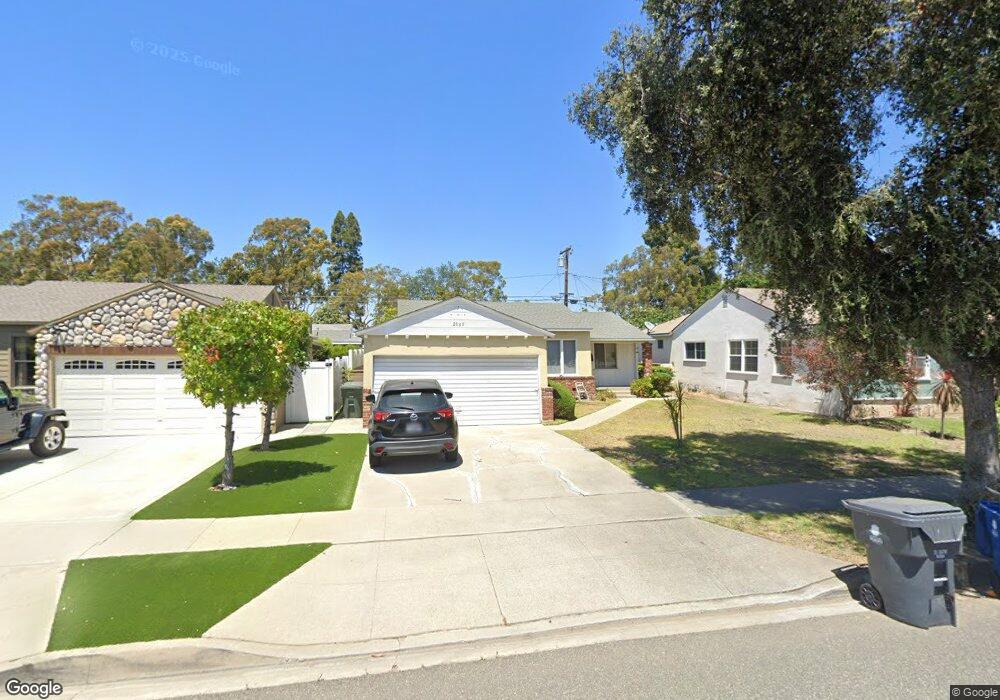
2869 Allred St Lakewood, CA 90712
Lakewood Mutual NeighborhoodEstimated Value: $806,000 - $871,000
2
Beds
1
Bath
1,236
Sq Ft
$677/Sq Ft
Est. Value
About This Home
This home is located at 2869 Allred St, Lakewood, CA 90712 and is currently estimated at $837,209, approximately $677 per square foot. 2869 Allred St is a home located in Los Angeles County with nearby schools including Riley Elementary School, Hoover Middle School, and Lakewood High School.
Ownership History
Date
Name
Owned For
Owner Type
Purchase Details
Closed on
Aug 9, 2024
Sold by
Frances Ballesteros Revocable Trust and Cheng Peggy
Bought by
Frances Ballesteros Revocable Trust and Cheng
Current Estimated Value
Purchase Details
Closed on
Dec 17, 2019
Sold by
Cardoso Madalena and The Hugo Ballesteros Trust
Bought by
Cheng Peggy and Frances Ballesteros Revocable
Purchase Details
Closed on
Mar 21, 2017
Sold by
Ballesteros Fu Erh
Bought by
Cheng Peggy and Frances Ballesteros Revocable Trust
Purchase Details
Closed on
Mar 16, 2017
Sold by
Ballesteros Hugo
Bought by
Ballesteros Hugo and Hugo Ballesteros Trust
Purchase Details
Closed on
May 27, 2002
Sold by
Ballesteros Frances and Balesteros Fu Erh
Bought by
Ballesteros Frances and The Frances Ballesteros Revocable Trust
Purchase Details
Closed on
Nov 14, 1993
Sold by
Ballesteros Hugo
Bought by
Ballesteros Hugo and Ballesteros Fu Erh
Create a Home Valuation Report for This Property
The Home Valuation Report is an in-depth analysis detailing your home's value as well as a comparison with similar homes in the area
Home Values in the Area
Average Home Value in this Area
Purchase History
| Date | Buyer | Sale Price | Title Company |
|---|---|---|---|
| Frances Ballesteros Revocable Trust | -- | None Listed On Document | |
| Cheng Peggy | -- | None Available | |
| Cheng Peggy | -- | None Available | |
| Ballesteros Hugo | -- | None Available | |
| Ballesteros Frances | -- | -- | |
| Ballesteros Hugo | -- | -- |
Source: Public Records
Tax History Compared to Growth
Tax History
| Year | Tax Paid | Tax Assessment Tax Assessment Total Assessment is a certain percentage of the fair market value that is determined by local assessors to be the total taxable value of land and additions on the property. | Land | Improvement |
|---|---|---|---|---|
| 2025 | $5,895 | $437,374 | $299,288 | $138,086 |
| 2024 | $5,895 | $428,799 | $293,420 | $135,379 |
| 2023 | $5,796 | $420,392 | $287,667 | $132,725 |
| 2022 | $5,450 | $412,150 | $282,027 | $130,123 |
| 2021 | $5,341 | $404,070 | $276,498 | $127,572 |
| 2020 | $5,115 | $382,427 | $265,163 | $117,264 |
| 2019 | $2,938 | $199,902 | $119,946 | $79,956 |
| 2018 | $2,818 | $195,984 | $117,595 | $78,389 |
| 2016 | $2,597 | $188,376 | $113,030 | $75,346 |
| 2015 | $2,503 | $185,548 | $111,333 | $74,215 |
| 2014 | $2,491 | $181,915 | $109,153 | $72,762 |
Source: Public Records
Map
Nearby Homes
- 2922 Eckleson St
- 2912 Yearling St
- 2918 Yearling St
- 3244 Centralia St
- 2523 Allred St
- 4559 Levelside Ave
- 2803 Frankel St
- 2739 Denmead St
- 2729 Greentop St
- 3638 Sandwood St
- 4944 Coke Ave
- 5450 N Paramount Blvd Unit 12
- 4328 Deeboyar Ave
- 4848 Oliva Ave
- 5500 Ackerfield Ave Unit 104
- 5530 Ackerfield Ave Unit 206
- 5602 Verdura Ave
- 4113 Brock Ave
- 4121 Country Club Dr
- 4740 Pepperwood Ave
- 2873 Allred St
- 2863 Allred St
- 2879 Allred St
- 2857 Allred St
- 2832 Del Amo Blvd
- 2826 Del Amo Blvd
- 2836 Del Amo Blvd
- 2842 Del Amo Blvd
- 2822 Del Amo Blvd
- 2883 Allred St
- 2853 Allred St
- 2864 Allred St
- 2870 Allred St
- 2860 Allred St
- 2846 Del Amo Blvd
- 2816 Del Amo Blvd
- 2856 Allred St
- 2903 Allred St
- 2847 Allred St
- 2880 Allred St