Estimated Value: $436,984 - $483,000
4
Beds
3
Baths
2,924
Sq Ft
$158/Sq Ft
Est. Value
About This Home
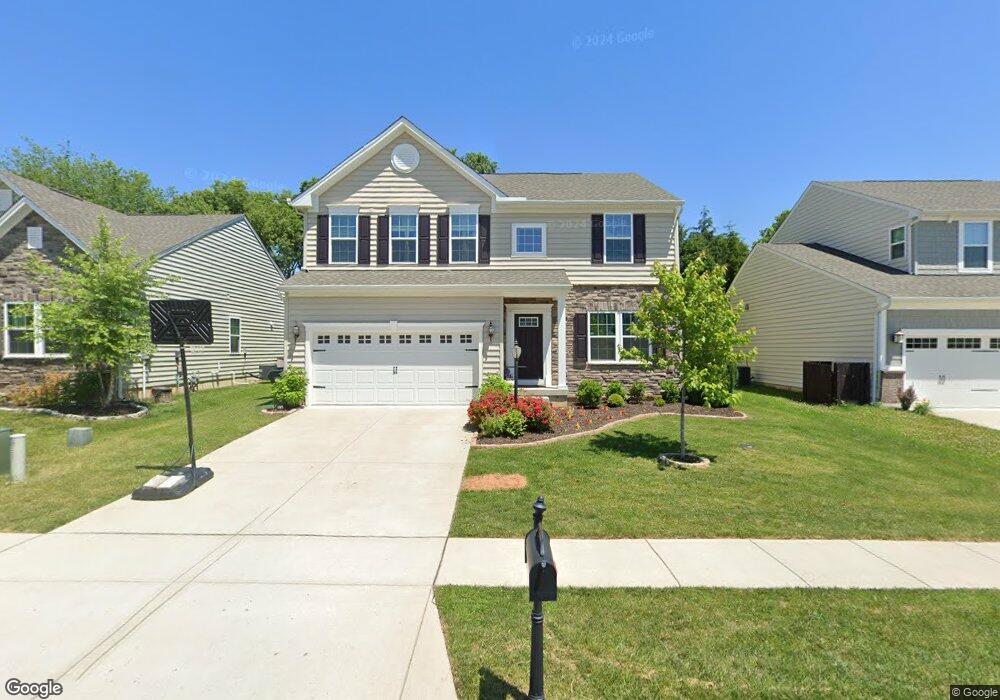
This home is located at 2869 Ridge View Ct, Xenia, OH 45385 and is currently estimated at $463,246, approximately $158 per square foot. 2869 Ridge View Ct is a home located in Greene County with nearby schools including Trebein Elementary School, Jacob Coy Middle School, and Beavercreek High School.
Ownership History
Date
Name
Owned For
Owner Type
Purchase Details
Closed on
Aug 25, 2020
Sold by
Weiss Steven and Weiss Theresa
Bought by
Souza Marco Da Silva
Current Estimated Value
Home Financials for this Owner
Home Financials are based on the most recent Mortgage that was taken out on this home.
Original Mortgage
$314,355
Outstanding Balance
$278,969
Interest Rate
2.9%
Mortgage Type
New Conventional
Estimated Equity
$184,277
Purchase Details
Closed on
Aug 3, 2018
Sold by
Gonbold Zolbayar and Erdenebat Munkhjargal
Bought by
Weiss Steven and Weiss Theresa
Home Financials for this Owner
Home Financials are based on the most recent Mortgage that was taken out on this home.
Original Mortgage
$274,500
Interest Rate
4.5%
Mortgage Type
New Conventional
Purchase Details
Closed on
Apr 26, 2017
Sold by
N V R Inc
Bought by
Ganbold Zolbayar and Erdenebat Munkhjargal
Purchase Details
Closed on
Jan 20, 2017
Sold by
Oberer Land Developers
Bought by
N V R Inc
Create a Home Valuation Report for This Property
The Home Valuation Report is an in-depth analysis detailing your home's value as well as a comparison with similar homes in the area
Home Values in the Area
Average Home Value in this Area
Purchase History
| Date | Buyer | Sale Price | Title Company |
|---|---|---|---|
| Souza Marco Da Silva | $330,900 | None Available | |
| Weiss Steven | $305,000 | None Available | |
| Ganbold Zolbayar | $261,300 | None Available | |
| N V R Inc | $55,900 | None Available |
Source: Public Records
Mortgage History
| Date | Status | Borrower | Loan Amount |
|---|---|---|---|
| Open | Souza Marco Da Silva | $314,355 | |
| Previous Owner | Weiss Steven | $274,500 |
Source: Public Records
Tax History Compared to Growth
Tax History
| Year | Tax Paid | Tax Assessment Tax Assessment Total Assessment is a certain percentage of the fair market value that is determined by local assessors to be the total taxable value of land and additions on the property. | Land | Improvement |
|---|---|---|---|---|
| 2024 | $7,701 | $130,730 | $22,170 | $108,560 |
| 2023 | $7,701 | $130,730 | $22,170 | $108,560 |
| 2022 | $7,371 | $109,330 | $18,470 | $90,860 |
| 2021 | $7,450 | $113,310 | $18,470 | $94,840 |
| 2020 | $7,757 | $113,310 | $18,470 | $94,840 |
| 2019 | $6,744 | $89,000 | $17,250 | $71,750 |
| 2018 | $5,874 | $13,800 | $13,800 | $0 |
| 2017 | $1,106 | $13,800 | $13,800 | $0 |
| 2016 | $0 | $0 | $0 | $0 |
Source: Public Records
Map
Nearby Homes
- 1281 Whitetail Dr
- 1878 Spring Meadows Dr
- 1788 Fawnwood Ct
- 1105 Windsong Trail
- 1922 Spring Ridge Dr
- 1395 Brookstone Dr
- 508 Glenhaven Way Unit 756-300
- 506 Glenhaven Way Unit 756-204
- 516 Glenhaven Way Unit 756-304
- 1800 Ash Meadow Ct
- 502 Glenhaven Way Unit 756-202
- 500 Glenhaven Way Unit 756-201
- 510 Glenhaven Way Unit 756-301
- 456 Glenhaven Way Unit 754-304
- 474 Glenhaven Way Unit 755-303
- 518 Glenhaven Way Unit 756-305
- 470 Glenhaven Way Unit 755-301
- 464 Glenhaven Way Unit 755-203
- 462 Glenhaven Way Unit 755-202
- 2657 Verdant Ln Unit 759-304
- 2863 Ridge View Ct
- 2875 Ridge View Ct
- 123 Ridgeview Ct
- 123 Ridge View Ct
- 111 Ridge View Ct
- 109 Ridge View Ct
- 124 Ridge View Ct
- 2859 Ridge View Ct
- 2881 Ridge View Ct
- 1230 Whitetail Dr
- 1240 Whitetail Dr
- 2853 Ridge View Ct
- 2887 Ridge View Ct
- 1822 New Germany Trebein Rd
- 2866 Ridge View Ct
- 2872 Ridge View Ct
- 1226 Whitetail Dr
- 1250 Whitetail Dr
- 2860 Ridge View Ct
- 2878 Ridge View Ct