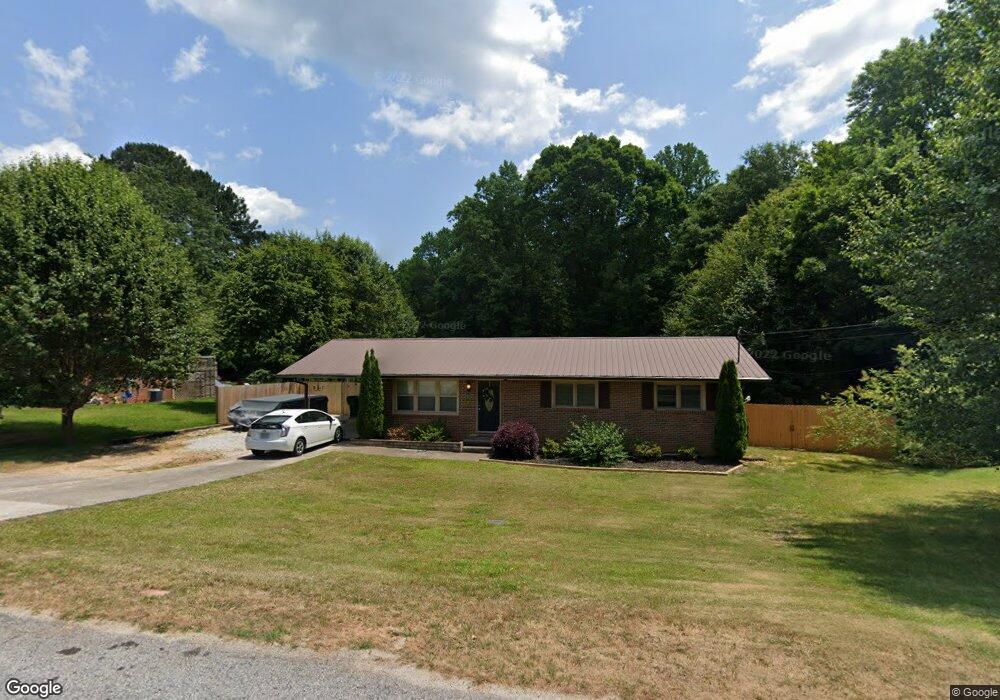
287 Lewis St Unit 25 Toccoa, GA 30577
Estimated Value: $170,714 - $188,000
3
Beds
2
Baths
1,100
Sq Ft
$161/Sq Ft
Est. Value
About This Home
This home is located at 287 Lewis St Unit 25, Toccoa, GA 30577 and is currently estimated at $177,429, approximately $161 per square foot. 287 Lewis St Unit 25 is a home located in Stephens County with nearby schools including Stephens County High School.
Ownership History
Date
Name
Owned For
Owner Type
Purchase Details
Closed on
Dec 31, 2014
Sold by
South State Bank
Bought by
Gailer John E and Gailer Rebekah
Current Estimated Value
Purchase Details
Closed on
Jul 1, 2014
Sold by
Welborn Janice
Bought by
South State Bank
Purchase Details
Closed on
Sep 11, 2008
Sold by
Not Provided
Bought by
Welborn Janice
Home Financials for this Owner
Home Financials are based on the most recent Mortgage that was taken out on this home.
Original Mortgage
$46,601
Interest Rate
6.49%
Mortgage Type
New Conventional
Purchase Details
Closed on
Mar 22, 2004
Bought by
<Buyer Info Not Present>
Purchase Details
Closed on
Feb 1, 1999
Bought by
<Buyer Info Not Present>
Create a Home Valuation Report for This Property
The Home Valuation Report is an in-depth analysis detailing your home's value as well as a comparison with similar homes in the area
Purchase History
| Date | Buyer | Sale Price | Title Company |
|---|---|---|---|
| Gailer John E | $35,000 | -- | |
| South State Bank | -- | -- | |
| Welborn Janice | $32,000 | -- | |
| Welborn Janice | $32,000 | -- | |
| <Buyer Info Not Present> | -- | -- | |
| <Buyer Info Not Present> | -- | -- |
Source: Public Records
Mortgage History
| Date | Status | Borrower | Loan Amount |
|---|---|---|---|
| Previous Owner | Welborn Janice | $46,601 |
Source: Public Records
Tax History
| Year | Tax Paid | Tax Assessment Tax Assessment Total Assessment is a certain percentage of the fair market value that is determined by local assessors to be the total taxable value of land and additions on the property. | Land | Improvement |
|---|---|---|---|---|
| 2025 | $1,256 | $45,751 | $3,537 | $42,214 |
| 2024 | $944 | $30,995 | $3,537 | $27,458 |
| 2023 | $862 | $28,949 | $3,537 | $25,412 |
| 2022 | $819 | $27,512 | $3,537 | $23,975 |
| 2021 | $800 | $25,583 | $3,537 | $22,046 |
| 2020 | $804 | $25,444 | $3,537 | $21,907 |
| 2019 | $807 | $25,444 | $3,537 | $21,907 |
| 2018 | $780 | $24,590 | $3,537 | $21,053 |
| 2017 | $785 | $24,374 | $3,537 | $20,837 |
| 2016 | $773 | $24,374 | $3,536 | $20,837 |
| 2015 | $465 | $24,012 | $3,536 | $20,475 |
| 2014 | $832 | $26,658 | $3,537 | $23,121 |
| 2013 | -- | $27,063 | $3,536 | $23,526 |
Source: Public Records
Map
Nearby Homes
- 208 Cherry St
- 926 Skyline Dr
- 1055 Skyline Dr
- 372 Hilltop Way
- 475 Hilltop Way
- 820 Collier Rd
- 704 Skyline Dr
- 158 Pebble Creek Dr
- 43 Sycamore Dr
- 39 Meadowbrook Dr
- 74 Briarwood Dr
- 0 Stephen Dr Unit 10710969
- 0 Stephen Dr Unit 10710891
- 207 Poplar Trail
- 0 Valley Dr Unit 10701357
- 526 Poplar St
- 321 Quail Forest Cir
- 253 Stancil Dr
- 122 King St
- 185 Stancil Dr
Your Personal Tour Guide
Ask me questions while you tour the home.