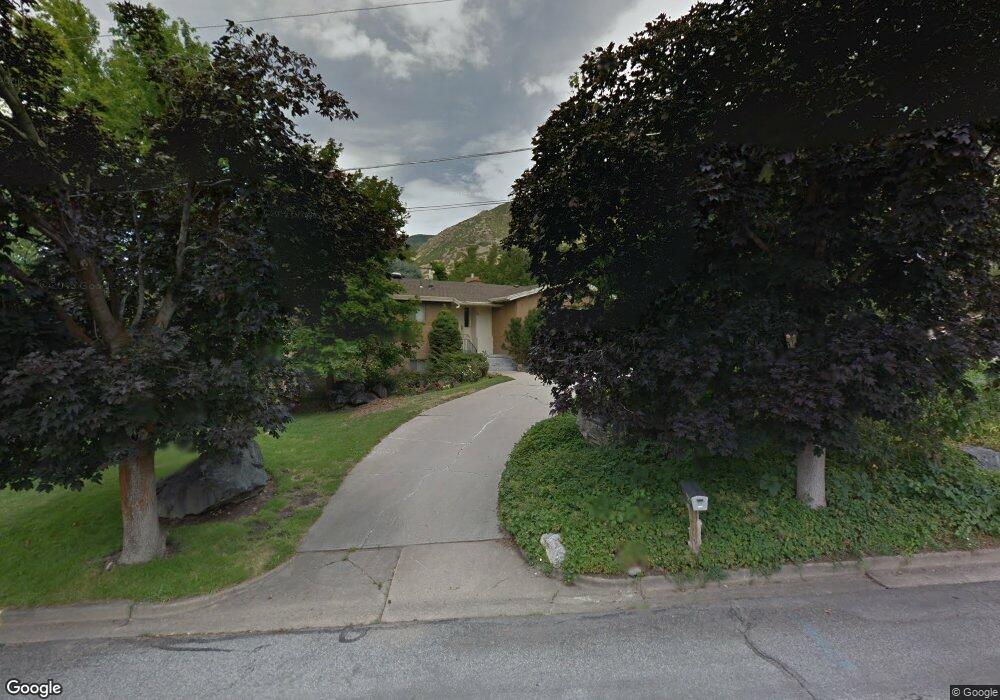
287 Oak Ln Farmington, UT 84025
Estimated Value: $618,000 - $748,000
4
Beds
3
Baths
1,788
Sq Ft
$384/Sq Ft
Est. Value
About This Home
This home is located at 287 Oak Ln, Farmington, UT 84025 and is currently estimated at $686,862, approximately $384 per square foot. 287 Oak Ln is a home located in Davis County with nearby schools including Farmington Elementary School, Farmington High, and Farmington Junior High School.
Ownership History
Date
Name
Owned For
Owner Type
Purchase Details
Closed on
May 29, 2018
Sold by
Guest Randall V
Bought by
Guest Jonathan L and Guest Renee B
Current Estimated Value
Home Financials for this Owner
Home Financials are based on the most recent Mortgage that was taken out on this home.
Original Mortgage
$439,000
Outstanding Balance
$375,548
Interest Rate
4.4%
Mortgage Type
New Conventional
Estimated Equity
$311,315
Purchase Details
Closed on
Sep 5, 2017
Sold by
Guest Family Trust
Bought by
Guest Audrey S
Create a Home Valuation Report for This Property
The Home Valuation Report is an in-depth analysis detailing your home's value as well as a comparison with similar homes in the area
Home Values in the Area
Average Home Value in this Area
Purchase History
| Date | Buyer | Sale Price | Title Company |
|---|---|---|---|
| Guest Jonathan L | -- | Advanced Title | |
| Guest Audrey S | -- | -- |
Source: Public Records
Mortgage History
| Date | Status | Borrower | Loan Amount |
|---|---|---|---|
| Open | Guest Jonathan L | $439,000 |
Source: Public Records
Tax History
| Year | Tax Paid | Tax Assessment Tax Assessment Total Assessment is a certain percentage of the fair market value that is determined by local assessors to be the total taxable value of land and additions on the property. | Land | Improvement |
|---|---|---|---|---|
| 2025 | $3,502 | $345,950 | $254,443 | $91,507 |
| 2024 | $3,576 | $357,499 | $254,443 | $103,056 |
| 2023 | $3,431 | $343,750 | $168,955 | $174,794 |
| 2022 | $3,492 | $657,000 | $306,187 | $350,813 |
| 2021 | $3,337 | $514,000 | $259,523 | $254,477 |
| 2020 | $2,917 | $438,000 | $222,820 | $215,180 |
| 2019 | $2,890 | $421,000 | $205,996 | $215,004 |
| 2018 | $2,689 | $386,000 | $201,690 | $184,310 |
| 2016 | $2,499 | $184,635 | $79,171 | $105,464 |
| 2015 | $2,352 | $164,945 | $79,171 | $85,774 |
| 2014 | $2,451 | $176,603 | $79,257 | $97,346 |
| 2013 | -- | $148,622 | $61,653 | $86,969 |
Source: Public Records
Map
Nearby Homes
Your Personal Tour Guide
Ask me questions while you tour the home.