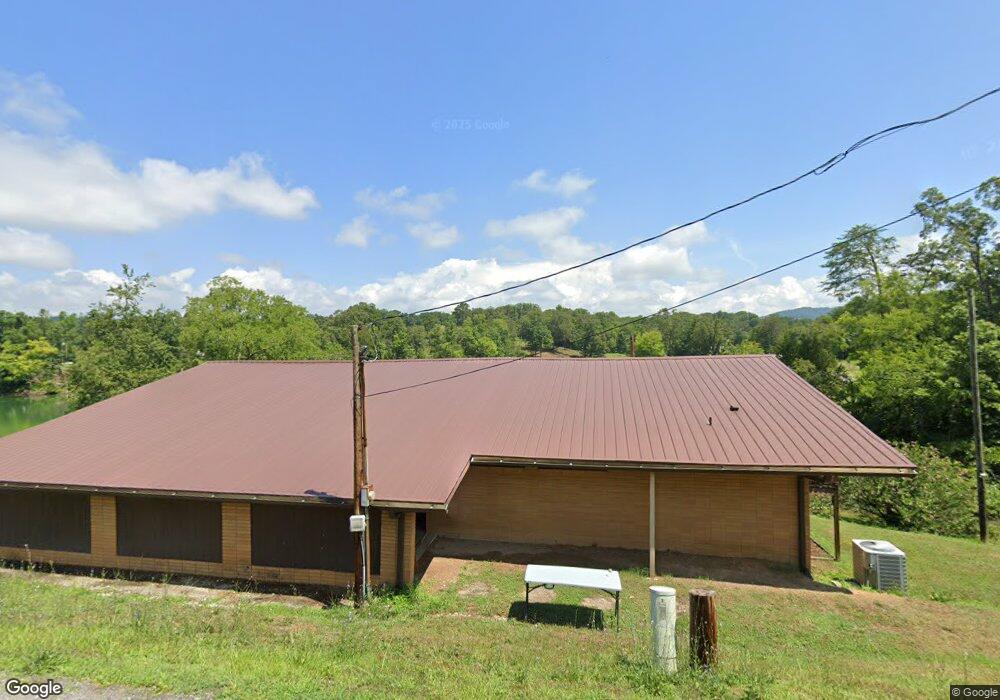
287 Shady Ln Bean Station, TN 37708
Estimated Value: $408,652 - $575,000
--
Bed
3
Baths
1,770
Sq Ft
$277/Sq Ft
Est. Value
About This Home
This home is located at 287 Shady Ln, Bean Station, TN 37708 and is currently estimated at $490,413, approximately $277 per square foot. 287 Shady Ln is a home located in Grainger County with nearby schools including Bean Station Elementary School, Rutledge Middle School, and Grainger High School.
Ownership History
Date
Name
Owned For
Owner Type
Purchase Details
Closed on
Sep 25, 2018
Sold by
Bentley June J and Banks Angela
Bought by
Banks Angeline E
Current Estimated Value
Home Financials for this Owner
Home Financials are based on the most recent Mortgage that was taken out on this home.
Original Mortgage
$60,000
Outstanding Balance
$44,981
Interest Rate
4.5%
Mortgage Type
Credit Line Revolving
Estimated Equity
$445,432
Purchase Details
Closed on
Sep 3, 2014
Sold by
Johnson Fleetwood
Bought by
Bentley June J and Banks Angela
Home Financials for this Owner
Home Financials are based on the most recent Mortgage that was taken out on this home.
Original Mortgage
$91,416
Interest Rate
4.16%
Mortgage Type
Cash
Purchase Details
Closed on
Jul 29, 2014
Sold by
Blake Ray G Estate
Bought by
Johnson Fleetwood
Home Financials for this Owner
Home Financials are based on the most recent Mortgage that was taken out on this home.
Original Mortgage
$91,416
Interest Rate
4.16%
Mortgage Type
Cash
Create a Home Valuation Report for This Property
The Home Valuation Report is an in-depth analysis detailing your home's value as well as a comparison with similar homes in the area
Home Values in the Area
Average Home Value in this Area
Purchase History
| Date | Buyer | Sale Price | Title Company |
|---|---|---|---|
| Banks Angeline E | -- | None Available | |
| Bentley June J | $71,000 | -- | |
| Johnson Fleetwood | $92,000 | -- |
Source: Public Records
Mortgage History
| Date | Status | Borrower | Loan Amount |
|---|---|---|---|
| Open | Banks Angeline E | $60,000 | |
| Previous Owner | Johnson Fleetwood | $91,416 |
Source: Public Records
Tax History Compared to Growth
Tax History
| Year | Tax Paid | Tax Assessment Tax Assessment Total Assessment is a certain percentage of the fair market value that is determined by local assessors to be the total taxable value of land and additions on the property. | Land | Improvement |
|---|---|---|---|---|
| 2024 | $1,810 | $77,025 | $25,825 | $51,200 |
| 2023 | $1,810 | $77,025 | $25,825 | $51,200 |
| 2022 | $1,769 | $77,025 | $25,825 | $51,200 |
| 2021 | $1,769 | $77,025 | $25,825 | $51,200 |
| 2020 | $1,290 | $77,025 | $25,825 | $51,200 |
| 2019 | $1,290 | $46,075 | $12,925 | $33,150 |
| 2018 | $1,094 | $45,200 | $12,925 | $32,275 |
| 2017 | $1,094 | $45,200 | $12,925 | $32,275 |
| 2016 | $1,094 | $45,200 | $12,925 | $32,275 |
| 2015 | $1,147 | $45,200 | $12,925 | $32,275 |
| 2014 | $1,147 | $45,880 | $0 | $0 |
Source: Public Records
Map
Nearby Homes
- 134 Circle Dr
- 2271 Broadway Dr
- 203 Lakeview Cir
- 1429 Rocky Summit Rd
- 602 Kirkham Rd
- 465 Livingston Rd
- 1245 County Line Rd
- 273 Bloomer Rd
- 337 White Ln
- Lot 6 Clearview Dr
- 223 Clearview Dr
- 1199 Oak Grove Rd
- 158 Delph Ln
- 124 Morrison Rd
- 4041 Harbor View Dr
- 242 Ridgeline Ct
- 4086 Harbor View Dr
- 4110 Harbor View Dr
- 4801 Harbor Dr
- 329 Simpson Ln