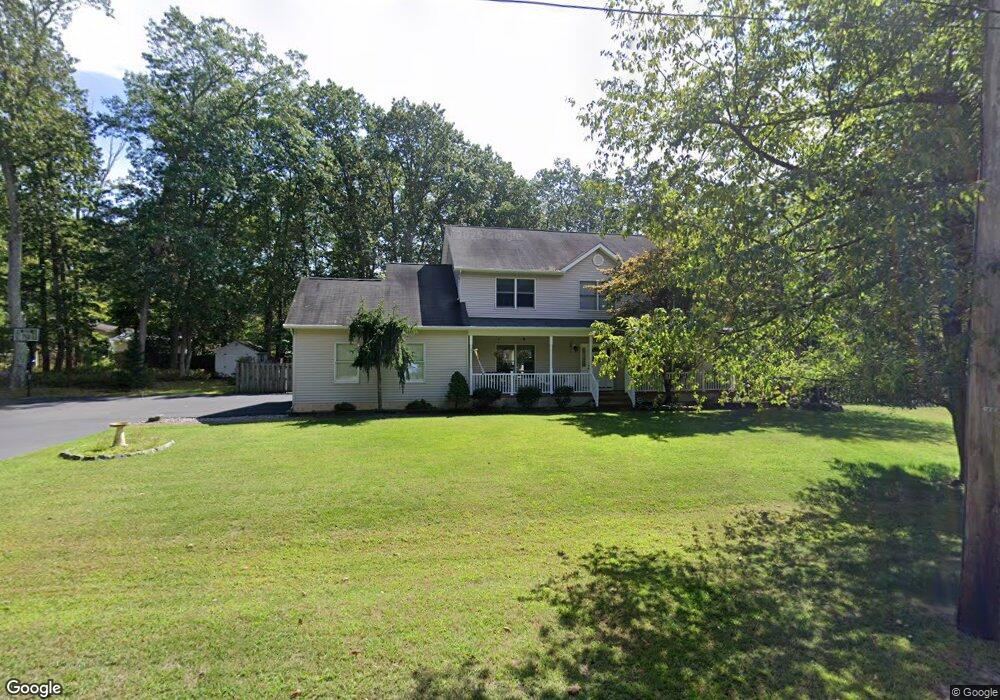
287 White St Howell, NJ 07731
Adelphia NeighborhoodEstimated Value: $765,722 - $884,000
4
Beds
2
Baths
2,393
Sq Ft
$350/Sq Ft
Est. Value
About This Home
This home is located at 287 White St, Howell, NJ 07731 and is currently estimated at $838,431, approximately $350 per square foot. 287 White St is a home located in Monmouth County with nearby schools including Land O' Pines School, Newbury School, and Howell Middle School North.
Ownership History
Date
Name
Owned For
Owner Type
Purchase Details
Closed on
Oct 5, 2021
Sold by
Stephen Meeks and Stephen Linda Oliver
Bought by
Meeks Stephen and Meeks Linda
Current Estimated Value
Purchase Details
Closed on
Jul 18, 2014
Sold by
Meeks Stephen and Oliver Gaeta Linda
Bought by
Meeks Stephen and Meeks Linda
Purchase Details
Closed on
Mar 9, 2010
Sold by
Walengewicz Linda and Sherry Steven
Bought by
Oliver Gaeta Linda and Meeks Stephen M
Purchase Details
Closed on
Apr 1, 2007
Sold by
Lickman Kenneth
Bought by
Walengewicz Lickman Linda
Purchase Details
Closed on
Feb 15, 2002
Sold by
Lynn Mark Homes Inc
Bought by
Lickman Kenneth
Home Financials for this Owner
Home Financials are based on the most recent Mortgage that was taken out on this home.
Original Mortgage
$268,000
Interest Rate
6.81%
Purchase Details
Closed on
May 25, 2000
Sold by
Grzelewski Stanislaw
Bought by
Casella Ralph and Casella Gina
Create a Home Valuation Report for This Property
The Home Valuation Report is an in-depth analysis detailing your home's value as well as a comparison with similar homes in the area
Home Values in the Area
Average Home Value in this Area
Purchase History
| Date | Buyer | Sale Price | Title Company |
|---|---|---|---|
| Meeks Stephen | -- | None Available | |
| Meeks Stephen | -- | None Available | |
| Oliver Gaeta Linda | $387,500 | Old Republic National Title | |
| Walengewicz Lickman Linda | -- | None Available | |
| Lickman Kenneth | $335,000 | -- | |
| Casella Ralph | $66,000 | -- |
Source: Public Records
Mortgage History
| Date | Status | Borrower | Loan Amount |
|---|---|---|---|
| Previous Owner | Lickman Kenneth | $268,000 |
Source: Public Records
Tax History
| Year | Tax Paid | Tax Assessment Tax Assessment Total Assessment is a certain percentage of the fair market value that is determined by local assessors to be the total taxable value of land and additions on the property. | Land | Improvement |
|---|---|---|---|---|
| 2025 | $10,806 | $666,200 | $264,100 | $402,100 |
| 2024 | $10,383 | $608,800 | $214,100 | $394,700 |
| 2023 | $10,383 | $557,600 | $172,100 | $385,500 |
| 2022 | $10,426 | $514,500 | $139,100 | $375,400 |
| 2021 | $10,426 | $454,300 | $139,100 | $315,200 |
| 2020 | $10,218 | $439,500 | $124,100 | $315,400 |
| 2019 | $10,459 | $441,300 | $124,100 | $317,200 |
| 2018 | $10,238 | $430,000 | $124,100 | $305,900 |
| 2017 | $10,417 | $432,400 | $129,100 | $303,300 |
| 2016 | $10,513 | $430,700 | $128,000 | $302,700 |
| 2015 | $10,503 | $426,100 | $128,000 | $298,100 |
| 2014 | $10,163 | $382,500 | $138,000 | $244,500 |
Source: Public Records
Map
Nearby Homes
- 265 White St
- 390 Conover St
- 292 White St
- 391 Conover St
- 0 Conover St Unit 21636459
- 0 Conover St Unit 21453484
- 0 Conover St
- 282 White St
- 384 Conover St
- 264 White St
- 395 Conover St
- 387 Conover St
- 408 Conover St
- 302 White St
- 405 Conover St
- 412 Conover St
- 376 Conover St
- 256 White St
- 409 Conover St
- 274 White St
Your Personal Tour Guide
Ask me questions while you tour the home.