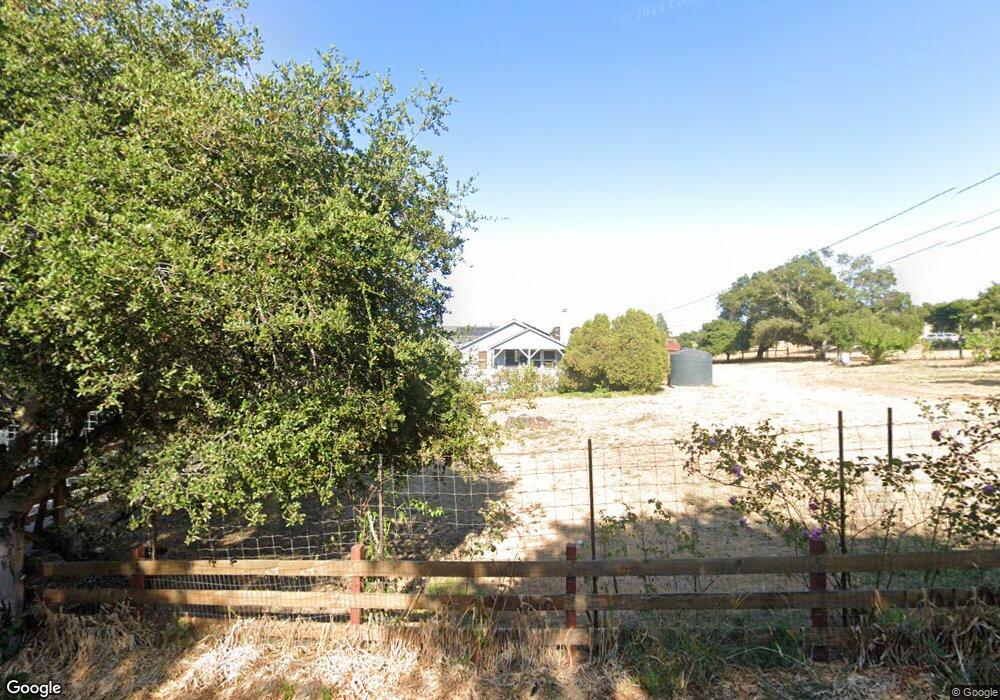
2870 Eastman Ln Petaluma, CA 94952
Estimated Value: $977,000 - $1,104,000
3
Beds
2
Baths
1,432
Sq Ft
$707/Sq Ft
Est. Value
About This Home
This home is located at 2870 Eastman Ln, Petaluma, CA 94952 and is currently estimated at $1,012,500, approximately $707 per square foot. 2870 Eastman Ln is a home located in Sonoma County with nearby schools including Wilson Elementary School, Petaluma Junior High School, and Petaluma High School.
Ownership History
Date
Name
Owned For
Owner Type
Purchase Details
Closed on
Oct 3, 2018
Sold by
Klimley Abbott P and Klimley Patricia M
Bought by
Klimley Peter and Klimley Patricia M
Current Estimated Value
Purchase Details
Closed on
Sep 7, 2011
Sold by
Klimley Abbott P and Klimley Patricia M
Bought by
Klimley Abbott P and Klimley Patricia M
Home Financials for this Owner
Home Financials are based on the most recent Mortgage that was taken out on this home.
Original Mortgage
$219,750
Outstanding Balance
$86,938
Interest Rate
4.37%
Mortgage Type
New Conventional
Estimated Equity
$925,562
Purchase Details
Closed on
Jun 26, 1996
Sold by
Garloff Margith I
Bought by
Klimley Abbott Peter and Klimley Patricia Mcintyre
Home Financials for this Owner
Home Financials are based on the most recent Mortgage that was taken out on this home.
Original Mortgage
$180,000
Interest Rate
8.09%
Mortgage Type
Seller Take Back
Purchase Details
Closed on
Oct 11, 1995
Sold by
Koby Stephanie A
Bought by
Koby Patrick E
Create a Home Valuation Report for This Property
The Home Valuation Report is an in-depth analysis detailing your home's value as well as a comparison with similar homes in the area
Home Values in the Area
Average Home Value in this Area
Purchase History
| Date | Buyer | Sale Price | Title Company |
|---|---|---|---|
| Klimley Peter | -- | None Available | |
| Klimley Abbott P | -- | Chicago Title Company | |
| Klimley Abbott Peter | $225,000 | Northwestern Title Security | |
| Koby Patrick E | -- | Old Republic Title |
Source: Public Records
Mortgage History
| Date | Status | Borrower | Loan Amount |
|---|---|---|---|
| Open | Klimley Abbott P | $219,750 | |
| Closed | Klimley Abbott Peter | $180,000 |
Source: Public Records
Tax History Compared to Growth
Tax History
| Year | Tax Paid | Tax Assessment Tax Assessment Total Assessment is a certain percentage of the fair market value that is determined by local assessors to be the total taxable value of land and additions on the property. | Land | Improvement |
|---|---|---|---|---|
| 2025 | $4,870 | $434,716 | $293,585 | $141,131 |
| 2024 | $4,870 | $426,193 | $287,829 | $138,364 |
| 2023 | $4,870 | $417,837 | $282,186 | $135,651 |
| 2022 | $4,569 | $409,645 | $276,653 | $132,992 |
| 2021 | $4,467 | $401,614 | $271,229 | $130,385 |
| 2020 | $4,500 | $397,497 | $268,448 | $129,049 |
| 2019 | $4,429 | $389,704 | $263,185 | $126,519 |
| 2018 | $4,404 | $382,064 | $258,025 | $124,039 |
| 2017 | $4,330 | $374,573 | $252,966 | $121,607 |
| 2016 | $4,192 | $367,229 | $248,006 | $119,223 |
| 2015 | $4,127 | $361,714 | $244,281 | $117,433 |
| 2014 | $4,076 | $354,629 | $239,496 | $115,133 |
Source: Public Records
Map
Nearby Homes
- 1525 Eastman Ln
- 4335 Bodega Ave
- 4288 Bodega Ave
- 268 Eucalyptus Rd
- 39 Volkers Dr
- 3234 Skillman Ln
- 673 Lohrman Ln
- 1060 Lohrman Ln
- 2590 Chileno Valley Rd
- 3150 Skillman Ln
- 1105 West St
- 1375 Gossage Ave
- 12 Dorenfeld Ct
- 509 Larch Dr
- 13 Fowler Ct
- 13 Dorenfeld Ct
- 513 Larch Dr
- 246 Edinburgh Ln
- 509 Rainsville Rd
- 1 Kazen Way
- 2805 Eastman Ln
- 2807 Eastman Ln
- 2920 Eastman Ln
- 2995 Eastman Ln
- 2590 Eastman Ln
- 2999 Eastman Ln
- 3000 Eastman Ln
- 2510 Eastman Ln
- 2515 Eastman Ln
- 3100 Eastman Ln
- 2420 Eastman Ln
- 1100 Stadler Ln
- 2400 Eastman Ln
- 3170 Eastman Ln
- 3091 Eastman Ln
- 2380 Eastman Ln
- 260 Goldman Ln
- 3191 Eastman Ln
- 3185 Eastman Ln
- 1102 Stadler Ln