Estimated Value: $731,658 - $816,000
3
Beds
2
Baths
1,424
Sq Ft
$548/Sq Ft
Est. Value
About This Home
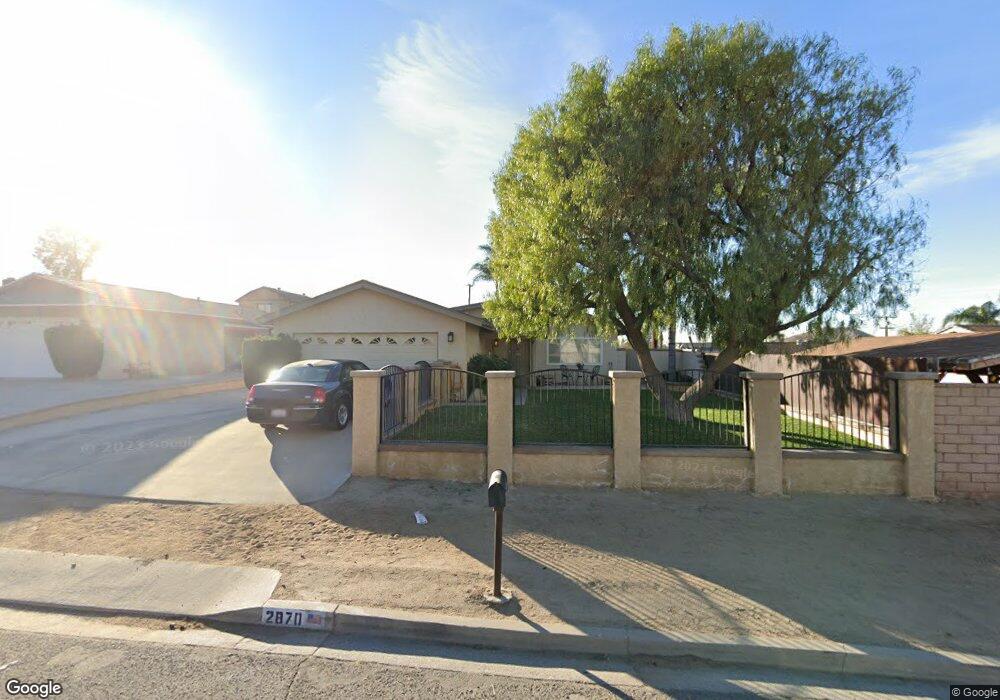
This home is located at 2870 Hillside Ave, Norco, CA 92860 and is currently estimated at $779,915, approximately $547 per square foot. 2870 Hillside Ave is a home located in Riverside County with nearby schools including Sierra Vista Elementary School, Norco Intermediate School, and Norco High School.
Ownership History
Date
Name
Owned For
Owner Type
Purchase Details
Closed on
Jul 16, 2003
Sold by
Cowgur Kim
Bought by
Erwin Jayne
Current Estimated Value
Home Financials for this Owner
Home Financials are based on the most recent Mortgage that was taken out on this home.
Original Mortgage
$178,400
Outstanding Balance
$93,376
Interest Rate
8.4%
Mortgage Type
Purchase Money Mortgage
Estimated Equity
$686,539
Purchase Details
Closed on
Oct 31, 1996
Sold by
Federal National Mortgage Association
Bought by
Erwin Jayne and Cowgur Kim
Home Financials for this Owner
Home Financials are based on the most recent Mortgage that was taken out on this home.
Original Mortgage
$115,400
Interest Rate
8.14%
Mortgage Type
Seller Take Back
Purchase Details
Closed on
Aug 5, 1996
Sold by
Johnson Robert S and Johnson Carol S
Bought by
Federal National Mortgage Association
Create a Home Valuation Report for This Property
The Home Valuation Report is an in-depth analysis detailing your home's value as well as a comparison with similar homes in the area
Home Values in the Area
Average Home Value in this Area
Purchase History
| Date | Buyer | Sale Price | Title Company |
|---|---|---|---|
| Erwin Jayne | -- | Security Union Title | |
| Erwin Jayne | $119,000 | Chicago Title Co | |
| Federal National Mortgage Association | $101,104 | Fidelity National Title Ins |
Source: Public Records
Mortgage History
| Date | Status | Borrower | Loan Amount |
|---|---|---|---|
| Open | Erwin Jayne | $178,400 | |
| Previous Owner | Erwin Jayne | $115,400 |
Source: Public Records
Tax History
| Year | Tax Paid | Tax Assessment Tax Assessment Total Assessment is a certain percentage of the fair market value that is determined by local assessors to be the total taxable value of land and additions on the property. | Land | Improvement |
|---|---|---|---|---|
| 2025 | $3,273 | $305,775 | $105,196 | $200,579 |
| 2023 | $3,273 | $293,904 | $101,112 | $192,792 |
| 2022 | $3,166 | $288,142 | $99,130 | $189,012 |
| 2021 | $3,101 | $282,493 | $97,187 | $185,306 |
| 2020 | $3,066 | $279,597 | $96,191 | $183,406 |
| 2019 | $2,994 | $274,115 | $94,305 | $179,810 |
| 2018 | $2,924 | $268,741 | $92,456 | $176,285 |
| 2017 | $2,362 | $219,355 | $90,644 | $128,711 |
| 2016 | $2,337 | $215,055 | $88,867 | $126,188 |
| 2015 | $2,284 | $211,827 | $87,533 | $124,294 |
| 2014 | $2,124 | $200,817 | $85,819 | $114,998 |
Source: Public Records
Map
Nearby Homes
- 620 Vaughan St
- 3004 Dapplegray Ln
- 891 La Quinta Way
- 887 Kingman Dr
- 871 Hillside Ln
- 3243 Temescal Ave
- 1042 Frontier Rd
- 1090 4th St
- 1041 Lori Ct
- 3475 Hillside Ave
- 989 3rd St
- 3470 Pedley Ave
- 3563 Pedley Ave
- 1366 Arroyo Ln
- 3581 Corona Ave
- 2327 Temescal Ave
- 3070 Crestview Dr
- 3768 Center Ave
- 2633 Valley View Ave
- 3700 California Ave
Your Personal Tour Guide
Ask me questions while you tour the home.