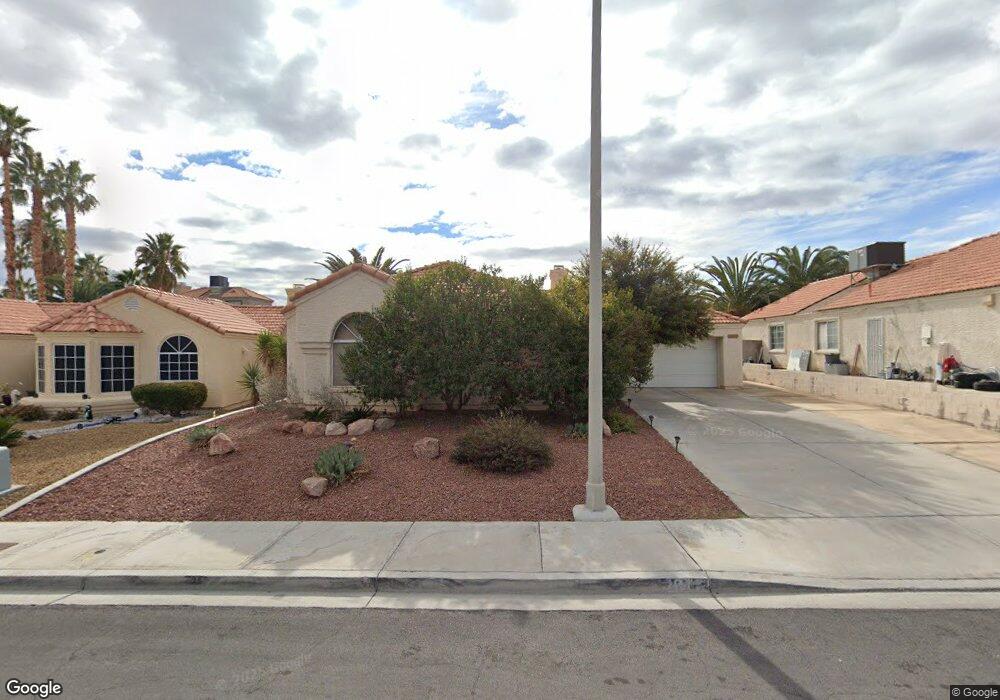
2870 Tori Way Henderson, NV 89074
Green Valley South NeighborhoodEstimated Value: $410,724 - $447,000
3
Beds
2
Baths
1,250
Sq Ft
$341/Sq Ft
Est. Value
About This Home
This home is located at 2870 Tori Way, Henderson, NV 89074 and is currently estimated at $425,931, approximately $340 per square foot. 2870 Tori Way is a home located in Clark County with nearby schools including Aggie Roberts Elementary School, Jack Lund Schofield Middle School, and Silverado High School.
Ownership History
Date
Name
Owned For
Owner Type
Purchase Details
Closed on
Apr 1, 2024
Sold by
Hosobuchi Rie
Bought by
Hosobuchi Rie and Maldonado Guillermo Alexander
Current Estimated Value
Purchase Details
Closed on
Apr 22, 2017
Sold by
Chi Rie Hosobu and Ishida Rie Hosobuchi
Bought by
Hosobuchi Rie and Hosobuchi Setsuko
Purchase Details
Closed on
Sep 16, 2015
Sold by
Ishida Morihisha and Ishida Rie H
Bought by
Ishida Rie Hosobuchi
Purchase Details
Closed on
Jan 21, 2012
Sold by
Hosobuchi Rie
Bought by
Ishida Morihisa and Ishida Rie H
Purchase Details
Closed on
Jun 10, 2010
Sold by
Burris Danna
Bought by
Hosobuchi Rie
Home Financials for this Owner
Home Financials are based on the most recent Mortgage that was taken out on this home.
Original Mortgage
$126,299
Interest Rate
5.12%
Mortgage Type
FHA
Purchase Details
Closed on
May 16, 2005
Sold by
Eldridge Patty J
Bought by
Burris Danna
Home Financials for this Owner
Home Financials are based on the most recent Mortgage that was taken out on this home.
Original Mortgage
$224,000
Interest Rate
6.37%
Mortgage Type
New Conventional
Purchase Details
Closed on
May 11, 2005
Sold by
Burris Darell
Bought by
Burris Danna
Home Financials for this Owner
Home Financials are based on the most recent Mortgage that was taken out on this home.
Original Mortgage
$224,000
Interest Rate
6.37%
Mortgage Type
New Conventional
Purchase Details
Closed on
Dec 6, 2002
Sold by
Larsen Rachelle L
Bought by
Eldridge Patty J
Home Financials for this Owner
Home Financials are based on the most recent Mortgage that was taken out on this home.
Original Mortgage
$121,600
Interest Rate
6.03%
Purchase Details
Closed on
Oct 26, 2000
Sold by
Eldridge Patty J
Bought by
Eldridge Patty J and Larsen Rachelle L
Home Financials for this Owner
Home Financials are based on the most recent Mortgage that was taken out on this home.
Original Mortgage
$108,385
Interest Rate
7.89%
Mortgage Type
FHA
Purchase Details
Closed on
Oct 22, 1998
Sold by
Sutton Bateman Barbara A and Sutton Barbara A
Bought by
Eldridge Patty J
Home Financials for this Owner
Home Financials are based on the most recent Mortgage that was taken out on this home.
Original Mortgage
$91,630
Interest Rate
9.99%
Purchase Details
Closed on
Oct 16, 1998
Sold by
Eldridge James E
Bought by
Eldridge Patty J
Home Financials for this Owner
Home Financials are based on the most recent Mortgage that was taken out on this home.
Original Mortgage
$91,630
Interest Rate
9.99%
Create a Home Valuation Report for This Property
The Home Valuation Report is an in-depth analysis detailing your home's value as well as a comparison with similar homes in the area
Home Values in the Area
Average Home Value in this Area
Purchase History
| Date | Buyer | Sale Price | Title Company |
|---|---|---|---|
| Hosobuchi Rie | -- | None Listed On Document | |
| Hosobuchi Rie | -- | None Available | |
| Ishida Rie Hosobuchi | -- | None Available | |
| Ishida Morihisa | -- | None Available | |
| Hosobuchi Rie | $128,000 | Ticor Title Las Vegas | |
| Burris Danna | $280,000 | Chicago Title | |
| Burris Danna | -- | Chicago Title | |
| Eldridge Patty J | -- | National Title Company | |
| Eldridge Patty J | -- | Lawyers Title | |
| Eldridge Patty J | $119,000 | Lawyers Title | |
| Eldridge Patty J | -- | Lawyers Title |
Source: Public Records
Mortgage History
| Date | Status | Borrower | Loan Amount |
|---|---|---|---|
| Previous Owner | Hosobuchi Rie | $126,299 | |
| Previous Owner | Burris Danna | $224,000 | |
| Previous Owner | Eldridge Patty J | $121,600 | |
| Previous Owner | Eldridge Patty J | $108,385 | |
| Previous Owner | Eldridge Patty J | $91,630 | |
| Closed | Burris Danna | $56,000 |
Source: Public Records
Tax History Compared to Growth
Tax History
| Year | Tax Paid | Tax Assessment Tax Assessment Total Assessment is a certain percentage of the fair market value that is determined by local assessors to be the total taxable value of land and additions on the property. | Land | Improvement |
|---|---|---|---|---|
| 2025 | $1,474 | $80,086 | $36,750 | $43,336 |
| 2024 | $1,432 | $80,086 | $36,750 | $43,336 |
| 2023 | $1,168 | $74,892 | $33,250 | $41,642 |
| 2022 | $1,390 | $69,684 | $31,255 | $38,429 |
| 2021 | $1,350 | $62,672 | $25,900 | $36,772 |
| 2020 | $1,307 | $61,149 | $24,500 | $36,649 |
| 2019 | $1,269 | $59,168 | $22,750 | $36,418 |
| 2018 | $1,232 | $53,965 | $18,550 | $35,415 |
| 2017 | $1,565 | $53,981 | $17,850 | $36,131 |
| 2016 | $1,168 | $51,401 | $14,350 | $37,051 |
| 2015 | $1,165 | $42,904 | $9,450 | $33,454 |
| 2014 | $1,131 | $37,872 | $8,750 | $29,122 |
Source: Public Records
Map
Nearby Homes
- 160 Cologne Dr
- 158 Deanna Way
- 2901 Sarina Ave
- 2850 Nikki Place
- 149 Cologne Ct
- 2824 Mayfair Ave
- 2854 Mahogany Grove Ave
- 2723 Mallard Landing Ave Unit 4
- 216 Highgate St
- 2720 Knightsbridge Rd
- 2761 Carnation Ln
- 2716 Knightsbridge Rd
- 2755 Carnation Ln Unit 4
- 2526 Begonia Valley Ave
- 2766 Chokecherry Ave
- 2813 Cacto Ct
- 2719 Lovington Dr
- 2704 Coventry Green Ave
- 167 Wynntry Cir
- 240 Highgate St
- 2872 Tori Way
- 2868 Tori Way
- 2875 Nikki Terrace
- 2873 Nikki Terrace
- 2877 Nikki Terrace
- 2866 Tori Way
- 2871 Nikki Terrace
- 2871 Tori Way
- 2867 Tori Way
- 2876 Tori Way
- 2879 Nikki Terrace
- 2869 Nikki Terrace
- 2875 Tori Way
- 161 Fallon Dr
- 161 Fallon Dr Unit house
- 2865 Tori Way
- 159 Fallon Dr
- 156 Enloe St
- 157 Fallon Dr
- 2878 Tori Way