28701 W Plum Tree Rd Barrington Hills, IL 60010
North Barrington Hills NeighborhoodEstimated Value: $1,677,000 - $1,991,789
5
Beds
7
Baths
7,297
Sq Ft
$247/Sq Ft
Est. Value
About This Home
This home is located at 28701 W Plum Tree Rd, Barrington Hills, IL 60010 and is currently estimated at $1,805,596, approximately $247 per square foot. 28701 W Plum Tree Rd is a home located in Lake County with nearby schools including Countryside Elementary School, Barrington Middle School Station Campus, and Barrington High School.
Ownership History
Date
Name
Owned For
Owner Type
Purchase Details
Closed on
Apr 11, 2019
Sold by
Stusowski Zenona and Stusowski Edward
Bought by
Chebanenko Dmitriy and Chebanenko Inna
Current Estimated Value
Home Financials for this Owner
Home Financials are based on the most recent Mortgage that was taken out on this home.
Original Mortgage
$717,500
Outstanding Balance
$625,198
Interest Rate
3.87%
Mortgage Type
Adjustable Rate Mortgage/ARM
Estimated Equity
$1,180,398
Purchase Details
Closed on
Jul 18, 2001
Sold by
Stusowski Edward and Stusowski Zenona
Bought by
Sandmeier John A and Sandmeier Carol
Home Financials for this Owner
Home Financials are based on the most recent Mortgage that was taken out on this home.
Original Mortgage
$900,000
Interest Rate
7.15%
Purchase Details
Closed on
Oct 20, 1999
Sold by
Pynsky Raymond and Pynsky Phyllis
Bought by
Stusowski Edward and Stusowski Zenona
Create a Home Valuation Report for This Property
The Home Valuation Report is an in-depth analysis detailing your home's value as well as a comparison with similar homes in the area
Home Values in the Area
Average Home Value in this Area
Purchase History
| Date | Buyer | Sale Price | Title Company |
|---|---|---|---|
| Chebanenko Dmitriy | $1,025,000 | Fidelity National Title | |
| Sandmeier John A | $1,620,000 | Stewart Title Company | |
| Stusowski Edward | $60,000 | -- |
Source: Public Records
Mortgage History
| Date | Status | Borrower | Loan Amount |
|---|---|---|---|
| Open | Chebanenko Dmitriy | $717,500 | |
| Previous Owner | Sandmeier John A | $900,000 |
Source: Public Records
Tax History Compared to Growth
Tax History
| Year | Tax Paid | Tax Assessment Tax Assessment Total Assessment is a certain percentage of the fair market value that is determined by local assessors to be the total taxable value of land and additions on the property. | Land | Improvement |
|---|---|---|---|---|
| 2024 | $43,467 | $598,679 | $69,202 | $529,477 |
| 2023 | $27,653 | $567,468 | $65,594 | $501,874 |
| 2022 | $27,653 | $358,067 | $59,367 | $298,700 |
| 2021 | $27,402 | $351,977 | $58,357 | $293,620 |
| 2020 | $27,042 | $350,890 | $58,177 | $292,713 |
| 2019 | $25,532 | $341,632 | $56,642 | $284,990 |
| 2018 | $33,338 | $458,845 | $70,740 | $388,105 |
| 2017 | $33,107 | $449,628 | $69,319 | $380,309 |
| 2016 | $37,777 | $612,414 | $77,027 | $535,387 |
| 2015 | $45,434 | $574,389 | $72,244 | $502,145 |
| 2014 | $45,960 | $557,320 | $72,466 | $484,854 |
| 2012 | $44,782 | $566,901 | $73,712 | $493,189 |
Source: Public Records
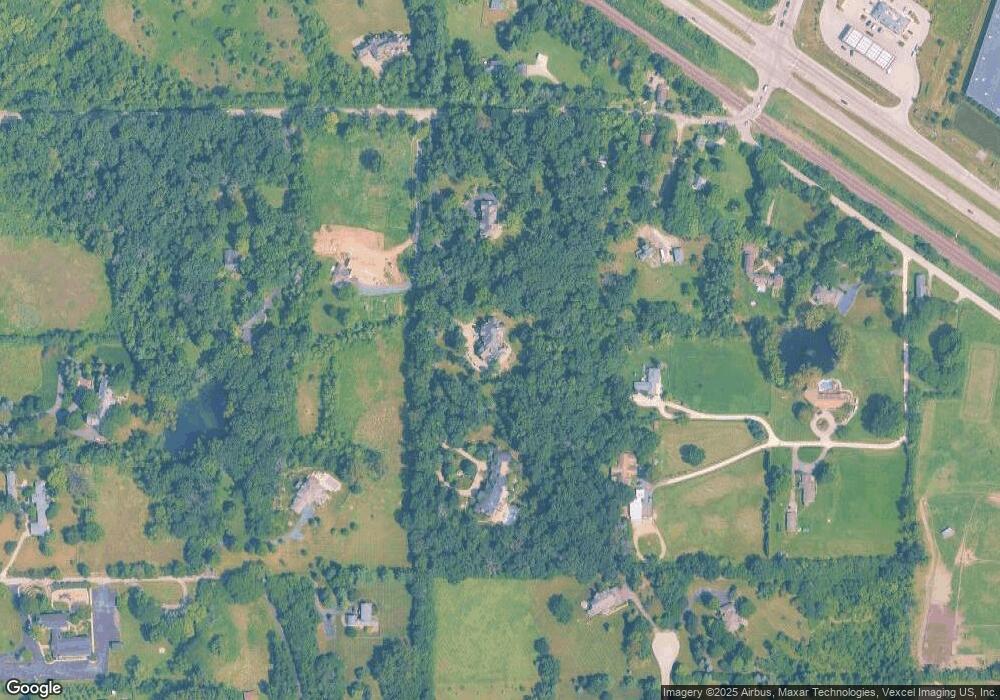
Map
Nearby Homes
- 599 Plum Tree Rd
- 166 Buckley Rd
- 60 Ridge Rd
- 14 W Surrey Ln
- 560 Oak Knoll Rd
- 546 Oak Knoll Rd
- 9209 Jasmine Way
- 1034 Heather Ct
- 6 Jacqueline Ln
- 12 Rock Ridge Rd
- 56 Huntcliff Ct
- 5 Jacqueline Ln
- 460 Hunters Way
- 27470 W Northwest Hwy
- 28442 W Main St
- LOT 2 Asbury Ave
- Lot 1 Asbury Ave
- 806 Norge Pkwy
- 28629 W Ravine Dr
- 80A Ridgecroft Ln
- 595 N Plum Tree Rd
- 595 N Plumtree Rd
- 597 N Plumtree Rd
- 28603 W Cuba Rd
- 28691 W Plum Tree Rd
- 28711 W Plum Tree Rd
- 587 N Plum Tree Rd
- 587 N Plumtree Rd
- 589 Plum Tree Rd
- 589 N Plumtree Rd
- 28605 W Seiberts Ridge
- 585 N Plumtree Rd
- 583 Plum Tree Rd
- 583 N Plumtree Rd
- 581 W Cuba Rd
- 591 N Plum Tree Rd
- 351 Ridge Rd
- 5 Hickory Ln
- 21710 Hickory Ln
- 21710 N Hickory Ln