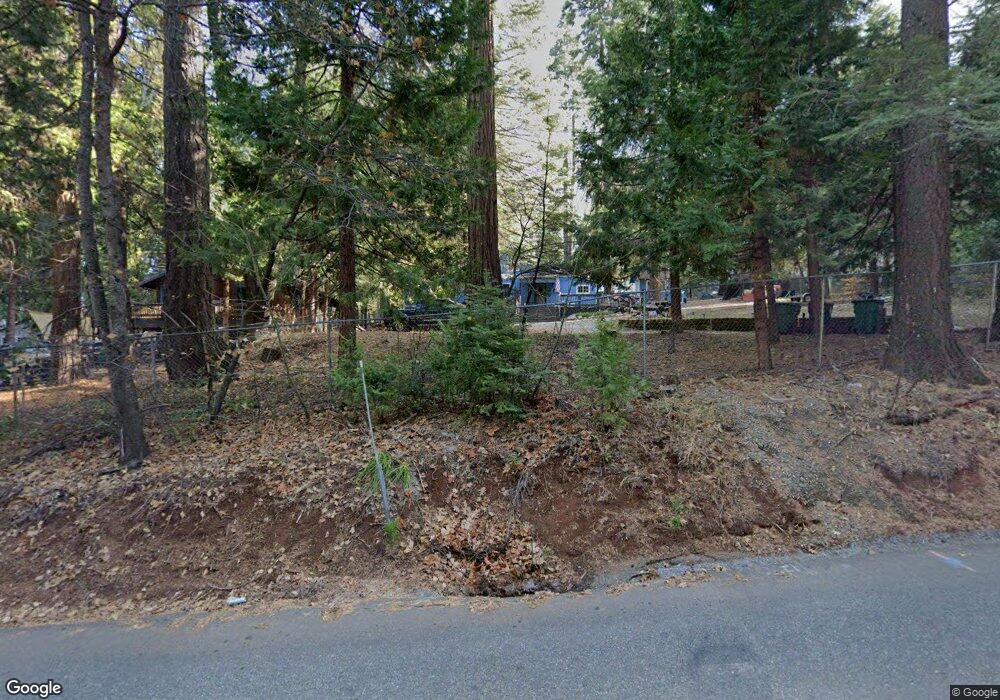
2871 Forebay Rd Pollock Pines, CA 95726
Estimated Value: $252,000 - $393,000
2
Beds
1
Bath
816
Sq Ft
$388/Sq Ft
Est. Value
About This Home
This home is located at 2871 Forebay Rd, Pollock Pines, CA 95726 and is currently estimated at $316,971, approximately $388 per square foot. 2871 Forebay Rd is a home located in El Dorado County with nearby schools including Pinewood Elementary School, Sierra Ridge Middle School, and El Dorado High School.
Ownership History
Date
Name
Owned For
Owner Type
Purchase Details
Closed on
Jul 8, 2022
Sold by
Hooper and Myra
Bought by
Hooper Michael J and Hooper Wolfgang
Current Estimated Value
Purchase Details
Closed on
Aug 16, 2011
Sold by
Federal National Mortgage Association
Bought by
Hooper Mike and Halton Hooper Myra
Home Financials for this Owner
Home Financials are based on the most recent Mortgage that was taken out on this home.
Original Mortgage
$57,000
Interest Rate
4.46%
Mortgage Type
New Conventional
Purchase Details
Closed on
Aug 9, 2011
Sold by
Hunt Scott Jason and Hunt Karina Noel
Bought by
Federal National Mortgage Association
Home Financials for this Owner
Home Financials are based on the most recent Mortgage that was taken out on this home.
Original Mortgage
$57,000
Interest Rate
4.46%
Mortgage Type
New Conventional
Purchase Details
Closed on
Mar 17, 2004
Sold by
Brown Carl and Brown Candi
Bought by
Hunt Scott Jason and Hunt Karina Noel
Home Financials for this Owner
Home Financials are based on the most recent Mortgage that was taken out on this home.
Original Mortgage
$218,250
Interest Rate
5.64%
Mortgage Type
Purchase Money Mortgage
Purchase Details
Closed on
Jan 31, 2003
Sold by
Brown Richard and Brown Linda
Bought by
Brown Carl and Brown Candi
Home Financials for this Owner
Home Financials are based on the most recent Mortgage that was taken out on this home.
Original Mortgage
$103,000
Interest Rate
5.75%
Purchase Details
Closed on
Jan 27, 1999
Sold by
Brown Richard Lee and Brown Linda Jaye
Bought by
Brown Richard and Brown Linda
Home Financials for this Owner
Home Financials are based on the most recent Mortgage that was taken out on this home.
Original Mortgage
$91,200
Interest Rate
6.63%
Purchase Details
Closed on
Jan 19, 1999
Sold by
Brown Carl Lee and Brown Candi Rachelle
Bought by
Brown Richard Lee and Brown Linda Jaye
Home Financials for this Owner
Home Financials are based on the most recent Mortgage that was taken out on this home.
Original Mortgage
$91,200
Interest Rate
6.63%
Purchase Details
Closed on
Feb 25, 1998
Sold by
Brown Carl Lee
Bought by
Brown Carl Lee and Brown Richard Lee
Purchase Details
Closed on
Oct 23, 1997
Sold by
Brown Candi Rachelle
Bought by
Brown Carl Lee
Purchase Details
Closed on
Feb 28, 1995
Sold by
Bertram Deborah L and Bertram Daryl B
Bought by
Brown Richard Lee and Brown Linda Jaye
Create a Home Valuation Report for This Property
The Home Valuation Report is an in-depth analysis detailing your home's value as well as a comparison with similar homes in the area
Home Values in the Area
Average Home Value in this Area
Purchase History
| Date | Buyer | Sale Price | Title Company |
|---|---|---|---|
| Hooper Michael J | -- | None Listed On Document | |
| Hooper Mike | $95,000 | First American Title Company | |
| Federal National Mortgage Association | $187,055 | Accommodation | |
| Hunt Scott Jason | $225,000 | Placer Title Co | |
| Brown Carl | -- | First American Title Co | |
| Brown Richard | -- | First American Title Ins Co | |
| Brown Richard Lee | -- | First American Title Ins Co | |
| Brown Carl Lee | -- | -- | |
| Brown Carl Lee | -- | Placer Title Company | |
| Brown Carl Lee | -- | Placer Title Company | |
| Brown Richard Lee | -- | Placer Title Company |
Source: Public Records
Mortgage History
| Date | Status | Borrower | Loan Amount |
|---|---|---|---|
| Previous Owner | Hooper Mike | $57,000 | |
| Previous Owner | Hunt Scott Jason | $218,250 | |
| Previous Owner | Brown Carl | $103,000 | |
| Previous Owner | Brown Richard | $91,200 |
Source: Public Records
Tax History
| Year | Tax Paid | Tax Assessment Tax Assessment Total Assessment is a certain percentage of the fair market value that is determined by local assessors to be the total taxable value of land and additions on the property. | Land | Improvement |
|---|---|---|---|---|
| 2025 | $1,321 | $119,308 | $25,113 | $94,195 |
| 2024 | $1,321 | $116,970 | $24,621 | $92,349 |
| 2023 | $1,297 | $114,678 | $24,139 | $90,539 |
| 2022 | $1,278 | $112,430 | $23,666 | $88,764 |
| 2021 | $1,265 | $110,226 | $23,202 | $87,024 |
| 2020 | $1,248 | $109,097 | $22,965 | $86,132 |
| 2019 | $1,230 | $106,959 | $22,515 | $84,444 |
| 2018 | $1,191 | $104,863 | $22,074 | $82,789 |
| 2017 | $1,158 | $102,808 | $21,642 | $81,166 |
| 2016 | $1,141 | $100,793 | $21,218 | $79,575 |
| 2015 | $1,117 | $99,281 | $20,900 | $78,381 |
| 2014 | $1,117 | $97,339 | $20,492 | $76,847 |
Source: Public Records
Map
Nearby Homes
- 2933 Forebay Rd Unit 10
- 2933 Forebay Rd Unit 25
- 2797 Forebay Rd
- 12 Rim St
- 6298 Fairview Dr
- 2893 Polaris St
- 6224 Drop Off Rd
- 3060 Leaf Cir
- 2925 Maple Ave
- 3220 Sly Park Rd
- 6780 Ridgeway Dr
- 6165 Pony Express Trail Unit 37
- 6165 Pony Express Trail Unit 20
- 6165 Pony Express Trail Unit 32
- 3224 York Ct
- 2960 Back Pack Trail
- 1229 Blair Rd
- 6613 Onyx Trail
- 6922 Ridgeway Dr
- 6060 Pony Express Trail Unit 18
- 2861 Forebay Rd
- 2857 Forebay Rd
- 5610 Eastwood Ln
- 2851 Forebay Rd
- 6468 Elf Ct
- 6544 Bandit Ct
- 5670 Eastwood Ln
- 2885 Forebay Rd
- 6469 Elf Ct
- 6495 Dobson Way
- 6485 Dobson Way
- 6485 Dobson Way Unit WA
- 6460 Elf Ct
- 6501 Dobson Way
- 2881 Forebay Rd
- 6532 Bandit Ct
- 6471 Agra St
- 6461 Elf Ct
- 5673 Eastwood Ln
- 6484 Dobson Way
Your Personal Tour Guide
Ask me questions while you tour the home.