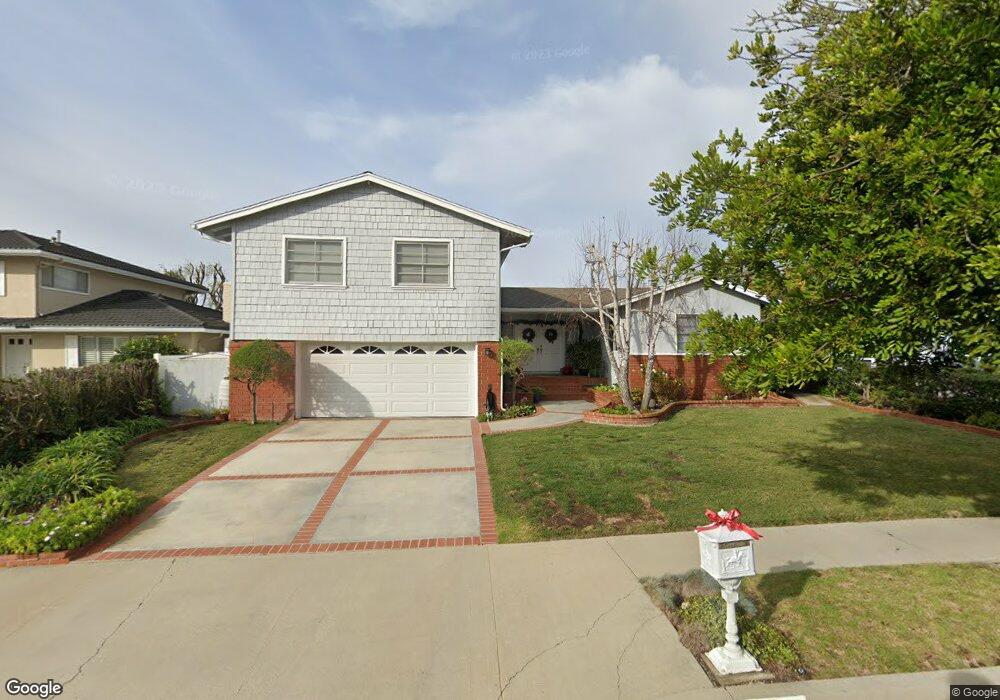
28713 King Arthur Ct Rancho Palos Verdes, CA 90275
Estimated Value: $2,099,296 - $2,524,000
4
Beds
4
Baths
3,080
Sq Ft
$760/Sq Ft
Est. Value
About This Home
This home is located at 28713 King Arthur Ct, Rancho Palos Verdes, CA 90275 and is currently estimated at $2,341,574, approximately $760 per square foot. 28713 King Arthur Ct is a home located in Los Angeles County with nearby schools including Montemalaga Elementary School, Ridgecrest Intermediate, and Palos Verdes Peninsula High School.
Ownership History
Date
Name
Owned For
Owner Type
Purchase Details
Closed on
Oct 23, 2002
Sold by
Kambe Edward M
Bought by
Kambe Edward M and Kambe Beverly K
Current Estimated Value
Home Financials for this Owner
Home Financials are based on the most recent Mortgage that was taken out on this home.
Original Mortgage
$150,000
Outstanding Balance
$61,598
Interest Rate
5.88%
Estimated Equity
$2,279,976
Purchase Details
Closed on
Aug 15, 2000
Sold by
Kambe Edward M
Bought by
Kambe Edward M and Kambe Beverly K
Purchase Details
Closed on
Oct 19, 1993
Sold by
Kambe Edward Mitsuo
Bought by
Kambe Edward Mitsuo and Kambe Beverly K
Home Financials for this Owner
Home Financials are based on the most recent Mortgage that was taken out on this home.
Original Mortgage
$165,000
Interest Rate
6.95%
Create a Home Valuation Report for This Property
The Home Valuation Report is an in-depth analysis detailing your home's value as well as a comparison with similar homes in the area
Home Values in the Area
Average Home Value in this Area
Purchase History
| Date | Buyer | Sale Price | Title Company |
|---|---|---|---|
| Kambe Edward M | -- | First American Title Ins Co | |
| Kambe Edward M | -- | -- | |
| Kambe Edward Mitsuo | -- | Investors Title Company |
Source: Public Records
Mortgage History
| Date | Status | Borrower | Loan Amount |
|---|---|---|---|
| Open | Kambe Edward M | $150,000 | |
| Closed | Kambe Edward Mitsuo | $165,000 |
Source: Public Records
Tax History Compared to Growth
Tax History
| Year | Tax Paid | Tax Assessment Tax Assessment Total Assessment is a certain percentage of the fair market value that is determined by local assessors to be the total taxable value of land and additions on the property. | Land | Improvement |
|---|---|---|---|---|
| 2025 | $7,656 | $656,157 | $300,407 | $355,750 |
| 2024 | $7,656 | $643,292 | $294,517 | $348,775 |
| 2023 | $7,459 | $630,680 | $288,743 | $341,937 |
| 2022 | $7,094 | $618,315 | $283,082 | $335,233 |
| 2021 | $7,064 | $606,192 | $277,532 | $328,660 |
| 2019 | $6,763 | $588,213 | $269,301 | $318,912 |
| 2018 | $7,083 | $576,680 | $264,021 | $312,659 |
| 2016 | $6,707 | $554,289 | $253,770 | $300,519 |
| 2015 | $6,727 | $545,964 | $249,959 | $296,005 |
| 2014 | $6,641 | $535,270 | $245,063 | $290,207 |
Source: Public Records
Map
Nearby Homes
- 6202 Lochvale Dr
- 28170 Ridgecove Ct S
- 28125 Ridgecove Ct S
- 5987 Peacock Ridge Rd Unit 101
- 5927 Armaga Spring Rd Unit I
- 29104 Doverridge Dr
- 28121 Highridge Rd Unit 405
- 28121 Highridge Rd Unit 402
- 48 Via Porto Grande
- 5907 Peacock Ridge Rd
- 28022 Ridgecove Ct N
- 15 Hilltop Cir
- 6509 Verde Ridge Rd
- 27925 Ridgebluff Ct
- 4 Hilltop Cir
- 28220 Highridge Rd Unit 104
- 28220 Highridge Rd Unit 208
- 92 Cottonwood Cir
- 6310 Ridgemar Ct
- 28012 Ridgeforest Ct
- 28719 King Arthur Ct
- 28707 King Arthur Ct
- 28724 Covecrest Dr
- 28718 Covecrest Dr
- 28727 King Arthur Ct
- 2924 Firthridge Rd
- 28730 Covecrest Dr
- 28701 King Arthur Ct
- 28710 Covecrest Dr
- 28716 King Arthur Ct
- 28710 King Arthur Ct
- 28738 Covecrest Dr
- 28700 King Arthur Ct
- 28704 King Arthur Ct
- 28704 Covecrest Dr
- 28736 King Arthur Ct
- 28731 King Arthur Ct
- 6128 Queenridge Dr
- 6124 Queenridge Dr
- 28744 Covecrest Dr