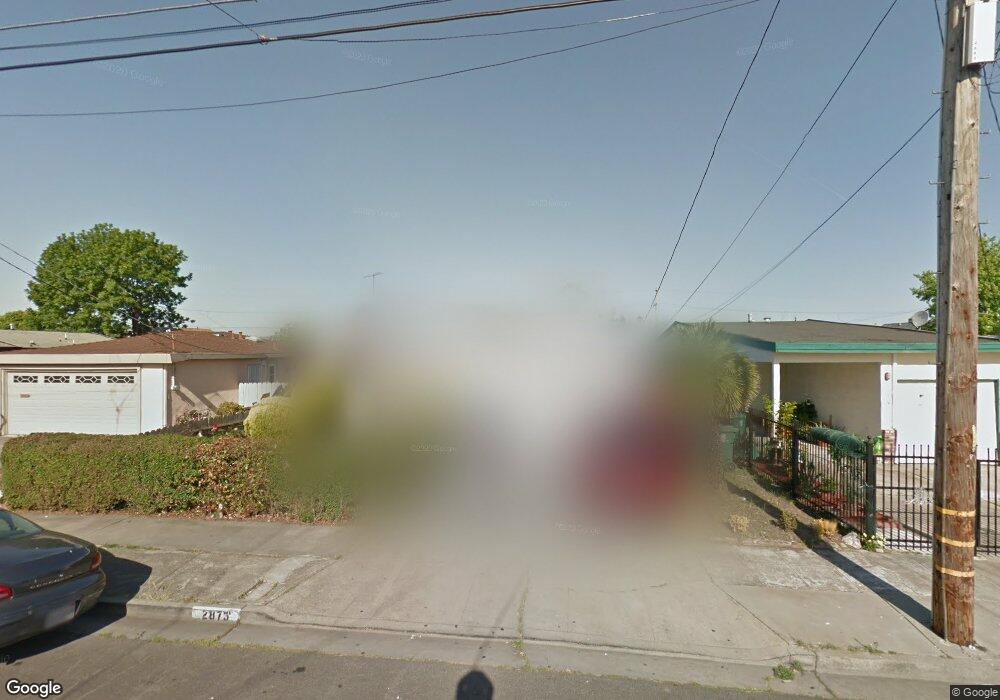
2873 18th St San Pablo, CA 94806
Estimated Value: $519,000 - $750,000
3
Beds
2
Baths
1,169
Sq Ft
$515/Sq Ft
Est. Value
About This Home
This home is located at 2873 18th St, San Pablo, CA 94806 and is currently estimated at $602,335, approximately $515 per square foot. 2873 18th St is a home located in Contra Costa County with nearby schools including Bayview Elementary School, Betty Reid Soskin Middle School, and De Anza Senior High School.
Ownership History
Date
Name
Owned For
Owner Type
Purchase Details
Closed on
Mar 31, 2006
Sold by
Quesada Salvador
Bought by
Jimenez Serafin
Current Estimated Value
Home Financials for this Owner
Home Financials are based on the most recent Mortgage that was taken out on this home.
Original Mortgage
$384,000
Outstanding Balance
$218,628
Interest Rate
6.2%
Mortgage Type
Fannie Mae Freddie Mac
Estimated Equity
$383,707
Purchase Details
Closed on
Feb 21, 2006
Sold by
Uribe Ruiz Luz Maria
Bought by
Jimenez Serafin
Home Financials for this Owner
Home Financials are based on the most recent Mortgage that was taken out on this home.
Original Mortgage
$384,000
Outstanding Balance
$218,628
Interest Rate
6.2%
Mortgage Type
Fannie Mae Freddie Mac
Estimated Equity
$383,707
Purchase Details
Closed on
Jul 25, 2005
Sold by
Quesada Salvador
Bought by
Quesada Salvador
Create a Home Valuation Report for This Property
The Home Valuation Report is an in-depth analysis detailing your home's value as well as a comparison with similar homes in the area
Home Values in the Area
Average Home Value in this Area
Purchase History
| Date | Buyer | Sale Price | Title Company |
|---|---|---|---|
| Jimenez Serafin | $480,000 | Old Republic Title Company | |
| Jimenez Serafin | -- | Old Republic Title Company | |
| Quesada Salvador | -- | -- |
Source: Public Records
Mortgage History
| Date | Status | Borrower | Loan Amount |
|---|---|---|---|
| Open | Jimenez Serafin | $384,000 |
Source: Public Records
Tax History Compared to Growth
Tax History
| Year | Tax Paid | Tax Assessment Tax Assessment Total Assessment is a certain percentage of the fair market value that is determined by local assessors to be the total taxable value of land and additions on the property. | Land | Improvement |
|---|---|---|---|---|
| 2025 | $8,310 | $575,000 | $410,000 | $165,000 |
| 2024 | $7,916 | $560,000 | $400,000 | $160,000 |
| 2023 | $7,916 | $532,000 | $377,000 | $155,000 |
| 2022 | $8,407 | $568,000 | $402,000 | $166,000 |
| 2021 | $7,466 | $488,000 | $346,000 | $142,000 |
| 2019 | $7,199 | $457,000 | $323,710 | $133,290 |
| 2018 | $5,796 | $366,000 | $259,251 | $106,749 |
| 2017 | $4,901 | $319,000 | $225,959 | $93,041 |
| 2016 | $4,457 | $284,000 | $201,167 | $82,833 |
| 2015 | $3,919 | $241,000 | $170,709 | $70,291 |
| 2014 | $3,432 | $202,000 | $143,084 | $58,916 |
Source: Public Records
Map
Nearby Homes
- 2867 18th St
- 2854 16th St
- 2773 21st St
- 2830 21st St Unit 32
- 2796 13th St
- 2817 13th St
- 14433 San Pablo Ave
- 2489 20th St
- 1911 Miner Ave
- 2872 10th St Unit 70
- 19 Haviland Ct
- 2716 Holly St
- 1371 Palmer Ave
- 1111 Stonington Ave
- 1905 Lovegrove Ave
- 3316 Monte Buena St
- 2600 Giant Rd Unit 28
- 1305 John Ave
- 112 Westgate Cir
- 2705 Glasgow Ct