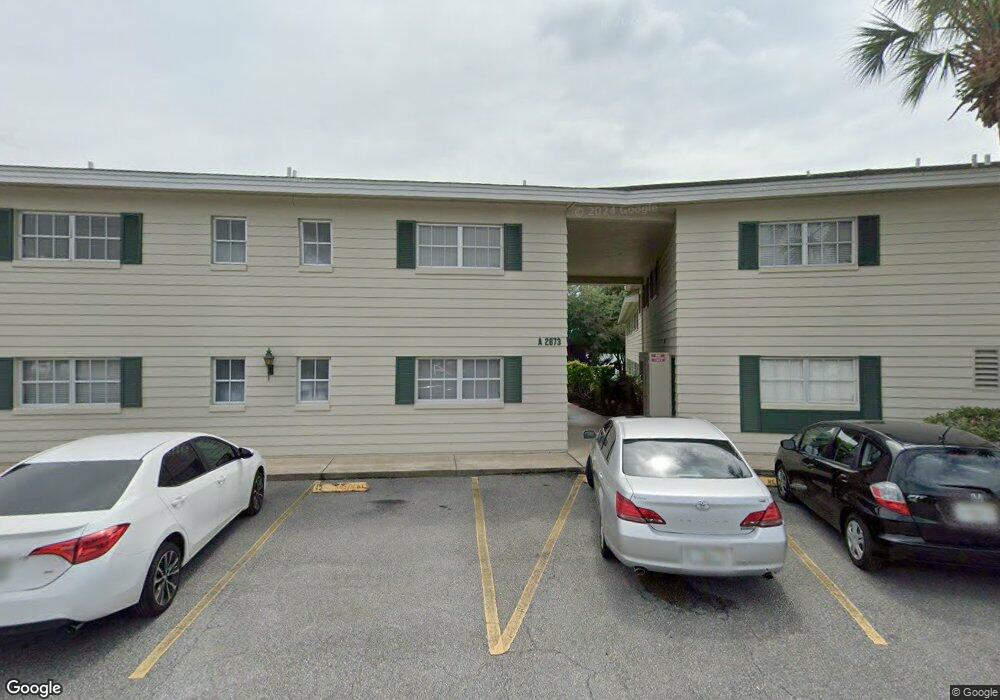
2873 S Osceola Ave Unit A5 Orlando, FL 32806
Southern Oaks NeighborhoodEstimated Value: $130,544 - $140,000
2
Beds
2
Baths
1,264
Sq Ft
$108/Sq Ft
Est. Value
About This Home
This home is located at 2873 S Osceola Ave Unit A5, Orlando, FL 32806 and is currently estimated at $136,136, approximately $107 per square foot. 2873 S Osceola Ave Unit A5 is a home located in Orange County with nearby schools including Blankner School, Boone High School, and Cornerstone Charter Academy High School.
Ownership History
Date
Name
Owned For
Owner Type
Purchase Details
Closed on
Aug 28, 2015
Sold by
Pineloch Holdings Llc
Bought by
Pham Mai Elizabeth
Current Estimated Value
Purchase Details
Closed on
Aug 4, 2011
Sold by
Dane Jason B
Bought by
Pineloch Holdings Llc
Purchase Details
Closed on
Sep 14, 2007
Sold by
Mitchell Kirk B and Mitchell Tracy L
Bought by
Dane Jason
Purchase Details
Closed on
Jan 10, 2003
Sold by
Drummond Dan G and Drummond Jane A
Bought by
Mitchell Kirk B and Mitchell Tracy L
Purchase Details
Closed on
Nov 1, 1993
Sold by
Young John W
Bought by
Drummond Dan G and Drummond Jane A
Home Financials for this Owner
Home Financials are based on the most recent Mortgage that was taken out on this home.
Original Mortgage
$27,000
Interest Rate
6.95%
Create a Home Valuation Report for This Property
The Home Valuation Report is an in-depth analysis detailing your home's value as well as a comparison with similar homes in the area
Home Values in the Area
Average Home Value in this Area
Purchase History
| Date | Buyer | Sale Price | Title Company |
|---|---|---|---|
| Pham Mai Elizabeth | $55,000 | First American Title Ins Co | |
| Pineloch Holdings Llc | $68,000 | Attorney | |
| Dane Jason | $101,000 | Pcs Title | |
| Mitchell Kirk B | $60,000 | Land Title Of Central Fl | |
| Drummond Dan G | $40,300 | -- |
Source: Public Records
Mortgage History
| Date | Status | Borrower | Loan Amount |
|---|---|---|---|
| Previous Owner | Drummond Dan G | $27,000 |
Source: Public Records
Tax History Compared to Growth
Tax History
| Year | Tax Paid | Tax Assessment Tax Assessment Total Assessment is a certain percentage of the fair market value that is determined by local assessors to be the total taxable value of land and additions on the property. | Land | Improvement |
|---|---|---|---|---|
| 2025 | $2,051 | $111,767 | -- | -- |
| 2024 | $1,848 | $111,767 | -- | -- |
| 2023 | $1,848 | $107,400 | $21,480 | $85,920 |
| 2022 | $1,716 | $101,100 | $20,220 | $80,880 |
| 2021 | $1,529 | $82,200 | $16,440 | $65,760 |
| 2020 | $1,338 | $72,700 | $14,540 | $58,160 |
| 2019 | $1,280 | $64,500 | $12,900 | $51,600 |
| 2018 | $1,199 | $60,700 | $12,140 | $48,560 |
| 2017 | $1,088 | $52,500 | $10,500 | $42,000 |
| 2016 | $1,011 | $47,400 | $9,480 | $37,920 |
| 2015 | $917 | $47,300 | $9,460 | $37,840 |
| 2014 | $889 | $47,300 | $9,460 | $37,840 |
Source: Public Records
Map
Nearby Homes
- 758 E Michigan St Unit 203
- 754 E Michigan St Unit 183
- 2800 Zephyr Rd
- 768 E Michigan St Unit 78
- 2928 Delaney St
- 2919 Sylvan Ave
- 2719 Keystone Dr
- 2634 Joslin Place
- 568 Scotia Place
- 2718 Keystone Dr
- 974 E Michigan St Unit 974B
- 976 E Michigan St Unit A
- 970 E Michigan St Unit B
- 401 E Jersey St
- 318 E Jersey St
- 528 Lanark Ct
- 508 Topaz Way
- 1050 E Michigan St Unit 1050B
- 2945 Lake Pineloch Blvd Unit 18-26
- 1068 E Michigan St Unit A
- 2873 S Osceola Ave Unit Pineloch Lake Condos
- 2873 S Osceola Ave Unit 8
- 2887 S Osceola Ave Unit 3
- 2887 S Osceola Ave
- 2873 S Osceola Ave Unit A
- 2893 S Osceola Ave Unit E7
- 2887 S Osceola Ave Unit D6
- 2873 S Osceola Ave Unit A6
- 2873 S Osceola Ave Unit A3
- 2893 S Osceola Ave Unit E3
- 2887 S Osceola Ave Unit D4
- 2893 S Osceola Ave Unit E4
- 2873 S Osceola Ave Unit A4
- 2893 S Osceola Ave Unit E5
- 2887 S Osceola Ave Unit D2
- 2887 S Osceola Ave Unit D3
- 2887 S Osceola Ave Unit D9
- 2887 S Osceola Ave Unit D5
- 2873 S Osceola Ave Unit A8
- 2893 S Osceola Ave Unit E2