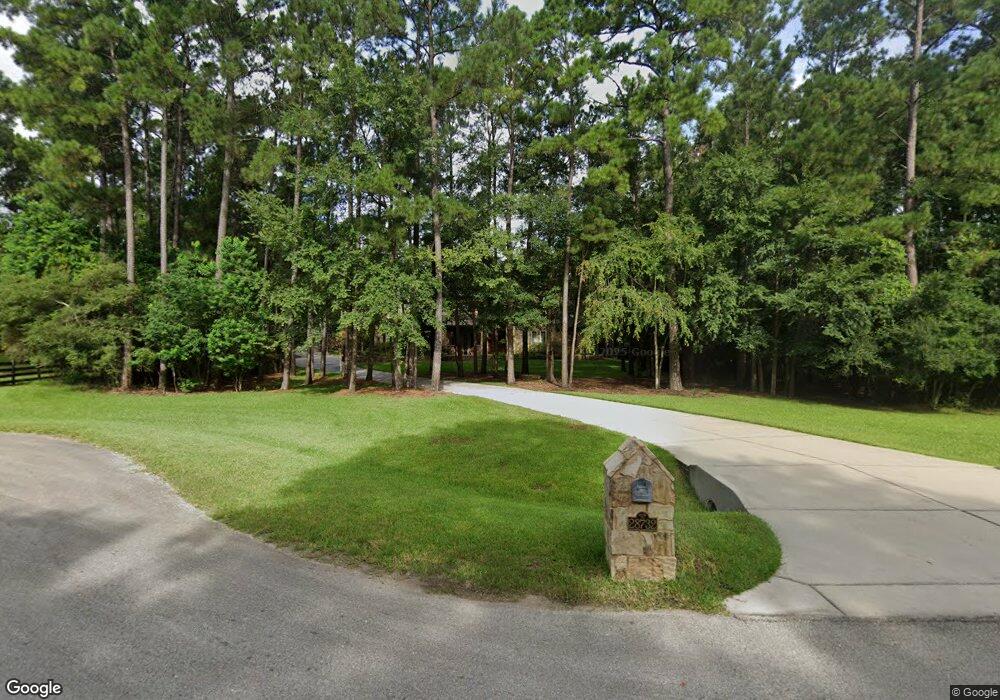
28732 Beth Marie Magnolia, TX 77355
Estimated Value: $1,041,316 - $1,290,000
--
Bed
1
Bath
4,578
Sq Ft
$259/Sq Ft
Est. Value
About This Home
This home is located at 28732 Beth Marie, Magnolia, TX 77355 and is currently estimated at $1,185,329, approximately $258 per square foot. 28732 Beth Marie is a home located in Montgomery County with nearby schools including Magnolia Elementary School, Magnolia Sixth Grade Campus, and Magnolia Junior High School.
Ownership History
Date
Name
Owned For
Owner Type
Purchase Details
Closed on
Jun 24, 2009
Sold by
Greene Brighton L and Greene Luda
Bought by
Bryant Wesley A and Bryant Laura L
Current Estimated Value
Home Financials for this Owner
Home Financials are based on the most recent Mortgage that was taken out on this home.
Original Mortgage
$82,500
Interest Rate
4.83%
Mortgage Type
Purchase Money Mortgage
Purchase Details
Closed on
Jun 25, 2002
Sold by
Chilek Michael W and Chilek Shelli Denee
Bought by
Greene Brighton L and Greene Luda
Home Financials for this Owner
Home Financials are based on the most recent Mortgage that was taken out on this home.
Original Mortgage
$43,650
Interest Rate
6.89%
Purchase Details
Closed on
Sep 12, 2000
Sold by
Jack Frey Properties Inc
Bought by
Bryant Wesley A and Bryant Laura
Create a Home Valuation Report for This Property
The Home Valuation Report is an in-depth analysis detailing your home's value as well as a comparison with similar homes in the area
Home Values in the Area
Average Home Value in this Area
Purchase History
| Date | Buyer | Sale Price | Title Company |
|---|---|---|---|
| Bryant Wesley A | -- | Stewart Title Houston Div | |
| Greene Brighton L | -- | Chicago Title | |
| Bryant Wesley A | -- | -- |
Source: Public Records
Mortgage History
| Date | Status | Borrower | Loan Amount |
|---|---|---|---|
| Closed | Bryant Wesley A | $82,500 | |
| Previous Owner | Greene Brighton L | $43,650 |
Source: Public Records
Tax History Compared to Growth
Tax History
| Year | Tax Paid | Tax Assessment Tax Assessment Total Assessment is a certain percentage of the fair market value that is determined by local assessors to be the total taxable value of land and additions on the property. | Land | Improvement |
|---|---|---|---|---|
| 2025 | $14,147 | $918,000 | $259,640 | $658,360 |
| 2024 | $12,746 | $1,014,728 | -- | -- |
| 2023 | $12,746 | $922,480 | $259,640 | $817,860 |
| 2022 | $14,798 | $838,620 | $213,020 | $813,680 |
| 2021 | $14,170 | $762,380 | $134,820 | $627,560 |
| 2020 | $15,178 | $750,000 | $134,820 | $615,180 |
| 2019 | $14,071 | $698,700 | $134,820 | $571,810 |
| 2018 | $12,041 | $617,000 | $84,820 | $532,180 |
| 2017 | $13,084 | $617,000 | $84,820 | $532,180 |
| 2016 | $15,098 | $712,000 | $84,820 | $627,180 |
| 2015 | $13,660 | $678,070 | $84,820 | $593,250 |
| 2014 | $13,660 | $646,910 | $84,820 | $562,090 |
Source: Public Records
Map
Nearby Homes
- 28632 Beth Marie
- 0 Boothill Rd Unit 38015944
- 16912 Wagon Wheel Rd
- 16407 Wagon Wheel Rd
- 28523 Beth Marie
- 28543 Beth Marie
- 16633 Cimmaron Dr
- TBD Cimmaron Dr
- 0 Frontier Rd
- 522 Whispering Meadow
- 420 Whispering Meadow
- 15937 Stagecoach Rd
- 322 Whispering Meadow
- 15823 Stagecoach Rd
- 000 Whispering Meadow
- 603 Terri Ln
- 15450 Shady Oaks Dr
- 36218 Post Oak Cir
- 37432 Clubhouse Ln
- 15245 Shady Oaks Dr
- 28722 Beth Marie
- 28742 Beth Marie
- 28752 Beth Marie
- 36712 High Chaparral
- 36722 High Chaparral
- 36532 Quiet Forest
- 36732 High Chaparral
- 36632 High Chaparral
- 28633 Beth Marie
- 36523 Quiet Forest
- 36802 High Chaparral
- 36622 High Chaparral
- 411-413 Wagon Wheel
- 36522 Quiet Forest
- Lot 414 Wagon Wheel
- 35613 High Chaparral
- 28622 Beth Marie
- 28332 Breezy Ct
- 16815 Wagon Wheel Rd
- 16711 Wagon Wheel Rd