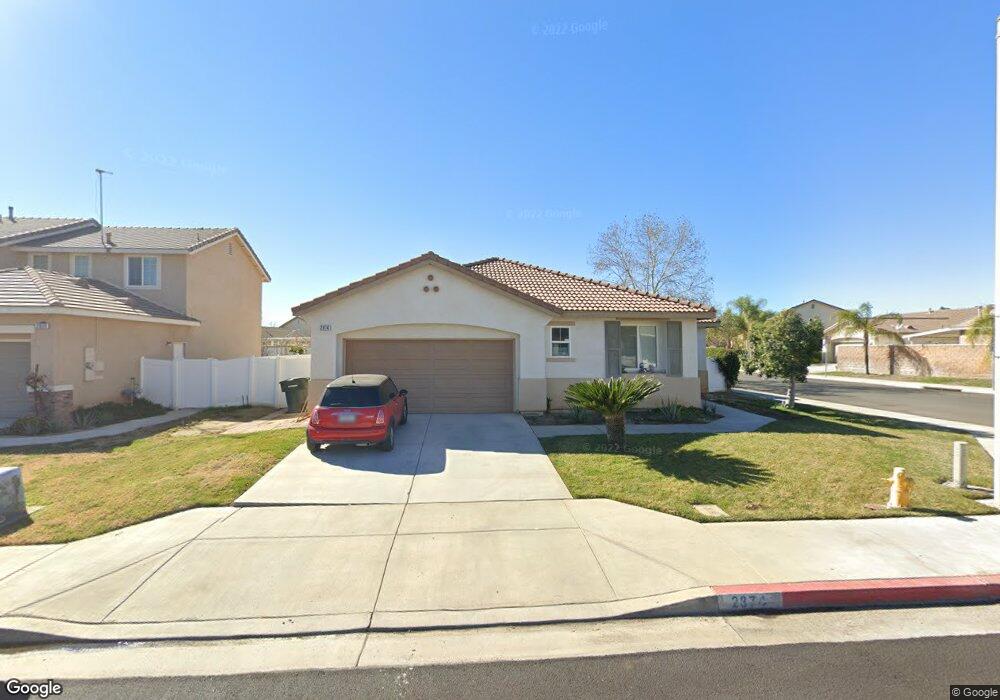
2874 Lake View Dr Perris, CA 92571
Central Perris NeighborhoodEstimated Value: $522,427 - $561,000
3
Beds
2
Baths
1,926
Sq Ft
$280/Sq Ft
Est. Value
About This Home
This home is located at 2874 Lake View Dr, Perris, CA 92571 and is currently estimated at $539,857, approximately $280 per square foot. 2874 Lake View Dr is a home located in Riverside County with nearby schools including Sierra Vista Elementary School, Lakeside Middle School, and Rancho Verde High School.
Ownership History
Date
Name
Owned For
Owner Type
Purchase Details
Closed on
Feb 15, 2025
Sold by
Contreras Marlon
Bought by
Thompson Liduvina and Thompson Luduvina
Current Estimated Value
Purchase Details
Closed on
Feb 7, 2025
Sold by
Thompson Liduvina
Bought by
Liduvina Thompson Revocable Trust and Thompson
Purchase Details
Closed on
Aug 11, 2014
Sold by
Thompson Liduvina and Contreras Marlon
Bought by
Thompson Liduvina and Contreras Marlon
Home Financials for this Owner
Home Financials are based on the most recent Mortgage that was taken out on this home.
Original Mortgage
$124,645
Interest Rate
4.11%
Mortgage Type
New Conventional
Purchase Details
Closed on
Mar 29, 2005
Sold by
Perris Clc Llc
Bought by
Thompson Luduvina and Contreras Marlon
Home Financials for this Owner
Home Financials are based on the most recent Mortgage that was taken out on this home.
Original Mortgage
$150,990
Interest Rate
5.84%
Mortgage Type
Fannie Mae Freddie Mac
Create a Home Valuation Report for This Property
The Home Valuation Report is an in-depth analysis detailing your home's value as well as a comparison with similar homes in the area
Home Values in the Area
Average Home Value in this Area
Purchase History
| Date | Buyer | Sale Price | Title Company |
|---|---|---|---|
| Thompson Liduvina | -- | None Listed On Document | |
| Liduvina Thompson Revocable Trust | -- | None Listed On Document | |
| Thompson Liduvina | -- | Title365 Company | |
| Thompson Luduvina | $301,000 | Fidelity National Title |
Source: Public Records
Mortgage History
| Date | Status | Borrower | Loan Amount |
|---|---|---|---|
| Previous Owner | Thompson Liduvina | $124,645 | |
| Previous Owner | Thompson Luduvina | $150,990 |
Source: Public Records
Tax History Compared to Growth
Tax History
| Year | Tax Paid | Tax Assessment Tax Assessment Total Assessment is a certain percentage of the fair market value that is determined by local assessors to be the total taxable value of land and additions on the property. | Land | Improvement |
|---|---|---|---|---|
| 2025 | $7,680 | $419,542 | $139,375 | $280,167 |
| 2023 | $7,680 | $403,253 | $133,964 | $269,289 |
| 2022 | $7,318 | $395,347 | $131,338 | $264,009 |
| 2021 | $6,984 | $369,521 | $122,374 | $247,147 |
| 2020 | $6,508 | $329,929 | $109,262 | $220,667 |
| 2019 | $6,272 | $320,320 | $106,080 | $214,240 |
| 2018 | $6,134 | $308,000 | $102,000 | $206,000 |
| 2017 | $5,830 | $283,000 | $94,000 | $189,000 |
| 2016 | $5,609 | $260,000 | $86,000 | $174,000 |
| 2015 | $5,321 | $236,000 | $78,000 | $158,000 |
| 2014 | $5,355 | $235,000 | $78,000 | $157,000 |
Source: Public Records
Map
Nearby Homes
- 3017 Lake View Dr
- 204 Punta Prieta Dr
- 3107 Lake View Dr
- 7 Placentia Ave
- 8 Placentia Ave
- 3070 Santo Tomas Ave
- 410 Water Ave
- 2490 Cavalcade Ct
- 174 Linden Ct
- 159 Linden Ct
- 3061 Clapper St
- 2363 Cloverfield St
- 914 Sparrow Way
- 531 Wildwood Ln
- 484 Harvest Rd
- 702 Camelia Dr
- 575 Prairie Way
- 0 W Rider St
- 3515 Churchill Ln
- 487 Lassa Way
- 2868 Lake View Dr
- 307 Holiday Ln
- 2886 Lake View Dr
- 2862 Lake View Dr
- 301 Holiday Ln
- 290 Holiday Ln
- 2895 Lake View Dr
- 2892 Lake View Dr
- 2901 Lake View Dr
- 293 Holiday Ln
- 318 Sparkler Ln
- 2856 Lake View Dr
- 2883 Lake View Dr
- 282 Holiday Ln
- 308 Sparkler Ln
- 2907 Lake View Dr
- 300 Sparkler Ln
- 2877 Lake View Dr
- 285 Holiday Ln
- 2994 Lake View Dr